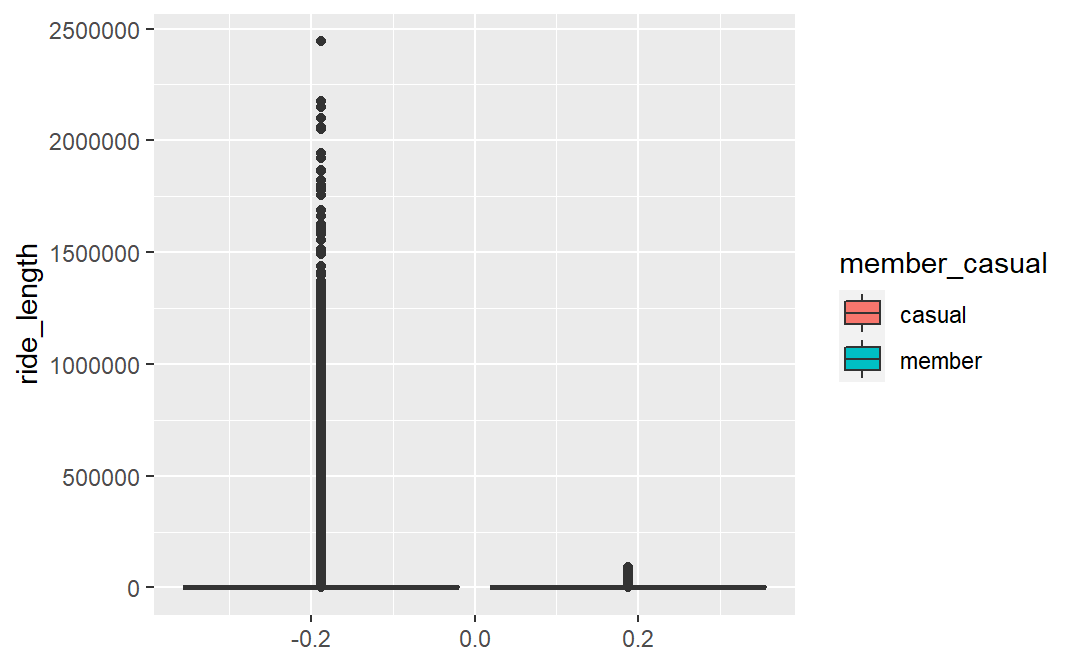
geom_boxplot() shows outliers (points outside of 1.5x IQR) as points. You do have a box, it is just that your outliers are so big and are so spread out the box has shrunk to nothing! You may have to change your y-axis scale, filter your data, or calculate boxplot parameters manually and use stat = "identity".
library(tidyverse)
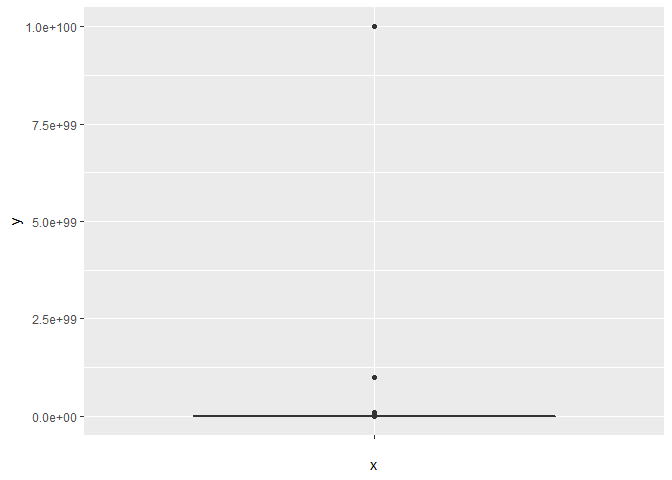
dat <- tibble(x = 1:100) %>%
mutate(y = 10 ^ x)
# linear - can't see box!
ggplot(dat, aes(x = "", y = y)) +
geom_boxplot()
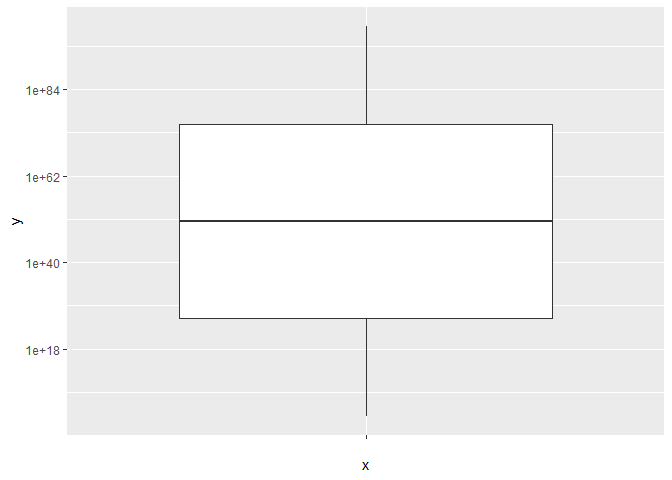
# log scale - there it is!
ggplot(dat, aes(x = "", y = y)) +
  geom_boxplot() +
  scale_y_log10()