Hello,
How are you? I am getting some problems when I rasterize to a CRS like "+proj=longlat +datum=WGS84 +no_defs"
I have some spatial data in Lambert projection so I am using rasterize to transform to "+proj=longlat +datum=WGS84 +no_defs". I am not sure if this is the best option to make a plot of that spatial data.
I leave here a part of the code:
xyz <- as.matrix(data.frame(x = array(long), y = array(lat), z = array(z)))
se especifica el CRS
#crs.latlon <- CRS("+proj=longlat +datum=WGS84")
crs.latlon <- CRS("+proj=longlat +datum=WGS84 +no_defs")
nrow <- 999
ncol <- 1249
se define el extent del dominio
ext <- extent(xyz[, c("x", "y")])
se crea raster con extent definido por nrow y ncol
rast <- raster(ext = ext, nrow = nrow, ncol = ncol, crs = crs.latlon)
rasterize los datos
rast <- rasterize(xyz[, c("x", "y")], rast,
xyz[, "z"],
fun = mean)
test_spdf <- as(rast, "SpatialPixelsDataFrame")
test_df <- as.data.frame(test_spdf)
colnames(test_df) <- c("value", "lon", "lat")
But then when I make the plot with ggplot I get some NA values in my domain. I leave here some part of the figure:
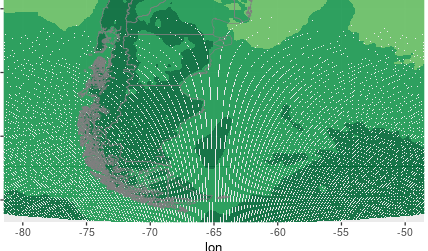
Could you help me to understand what is going on?
Thank you!
Kind regards,
Lorena