Hello all
I'm still very new to working with R and am absolutely despairing and unfortunately can't find a suitable answer for my problem.
I have collected all my data in an Excel. My dependent and independent variables are also displayed normally in the summary. With my control variables the following happens:
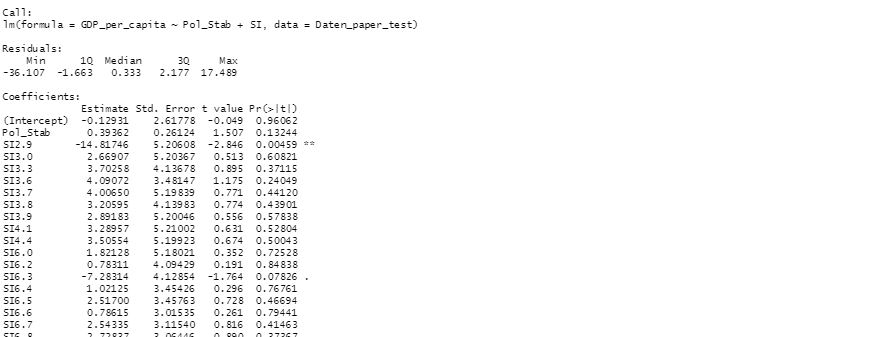
instead of me having a summary row for the control variable, all the sub-values appear (see Figure 1).
with my other control variables the same thing happens but instead of values NaN is displayed (for t-value, pr and Std.error) ... and I just don't understand what's wrong.
Do you know where my error could be? Many thanks already!
SI is a variable in the model and as such, coefficients are estimated for each level. What would you rather it do? What is the purpose of this variable in your model? I'm afraid I don't understand what you mean by 'control variable'.
Looking at your picture (by the way, it's generally much better to copy-and-paste text than to post a picture), it looks like your variables takes on discrete values. If you think that these values represent arbitrary different categories, then the use of dummy variables is right. If you think they represent a linear scale, then you don't want them entered as factors. Rather they should enter the same way your Pol_$tab enters.
You can convert factors to numbers using as.numeric(), but take a look at what you get to be sure you are getting the numbers you want. You may also want to create a tibble (from tidyverse) rather than a dataframe as you are less likely to have R make something a factor when you don't want it to be.
You can check whether R has turned something into a factor using the str() function.