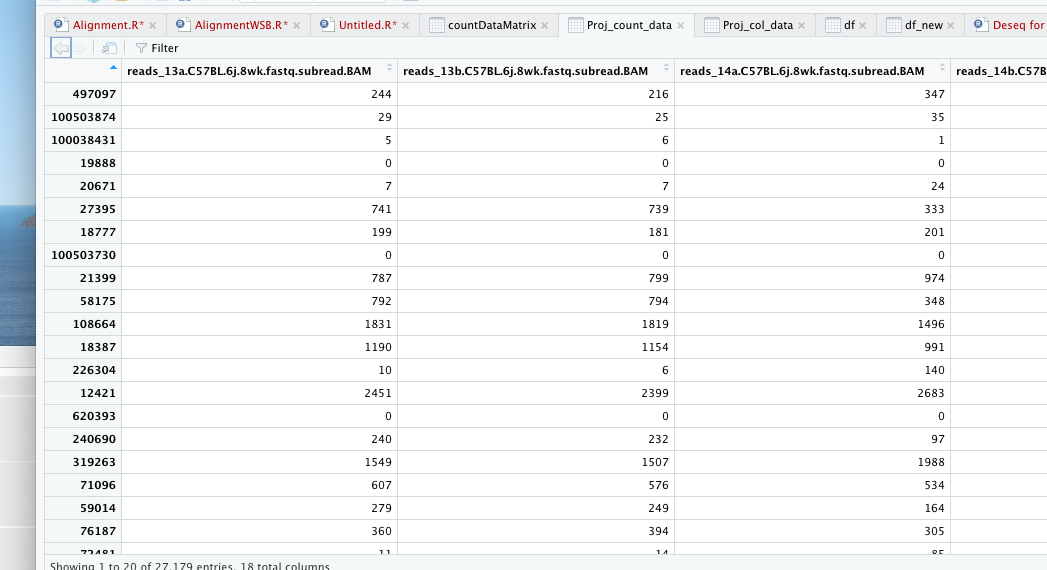
Proj_count_data = read.table (file = "/Volumes/eHDD40_10TB/PROJECTS/Ariane_RNA seq/Raw data_RNA seq_Ariane/Data/BL6/count_matrix.txt", header = T, row.names = 1, sep = '\t')
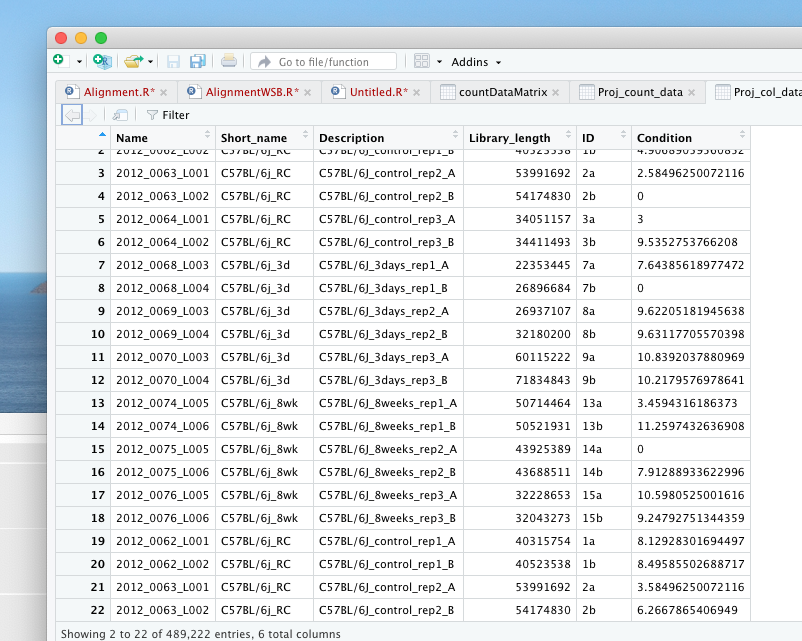
Proj_col_data = read.table(file = "/Volumes/eHDD40_10TB/PROJECTS/Ariane_RNA seq/Raw data_RNA seq_Ariane/Data/BL6/BL6Metadata.csv", header = T, sep = ';')
head(Proj_count_data,8)
boxplot(Proj_count_data)
hist(Proj_count_data [,1])
pseudoCount = log2(Proj_count_data + 1)
boxplot(pseudoCount)
hist(pseudoCount[,1])
library(DESeq2)
library(ggplot2)
library(reshape)
pseudoCount = as.data.frame(pseudoCount)
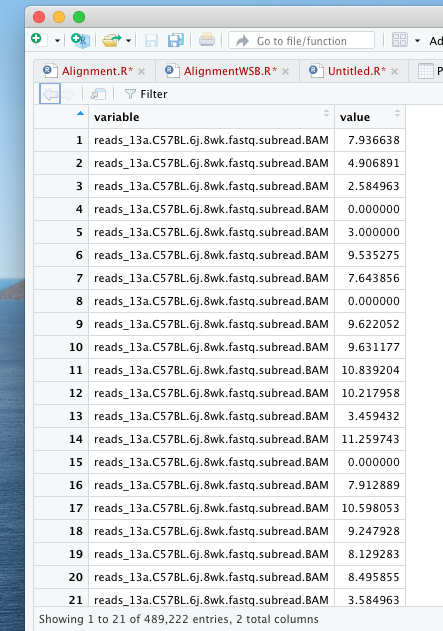
df = melt(pseudoCount, variable.name = "variable", value.name = "value") # reshape the matrix
write.table(df, file ="/Volumes/eHDD40_10TB/PROJECTS/Ariane_RNA seq/Raw data_RNA seq_Ariane/Data/BL6/count_matrixnamechanged.txt")
df_new = read.table (file = "/Volumes/eHDD40_10TB/PROJECTS/Ariane_RNA seq/Raw data_RNA seq_Ariane/Data/BL6/Copy of count_matrixnamechanged.txt", header = T, row.names = 1, sep = '\t')
df_new
df_new = data.frame(df_new, Condition = substr (df$value, 1,18))
ggplot(df_new, aes(x = value, y = X , fill = X)) + geom_boxplot() + xlab("") +
ylab(expression(log[2](count + 1)))
dim(as.matrix(Proj_col_data))
dim(as.matrix(Proj_count_data))
we're testing for the different condidtions
dds = DESeqDataSetFromMatrix(countData = Proj_count_data, colData = Proj_col_data, design =~ Condition)
dds
dim(as.matrix(Proj_col_data))
[1] 489222 6
dim(as.matrix(Proj_count_data))
[1] 27179 18
dds = DESeqDataSetFromMatrix(countData = Proj_count_data, colData = Proj_col_data, design =~ Condition)
Error in DESeqDataSetFromMatrix(countData = Proj_count_data, colData = Proj_col_data, :
ncol(countData) == nrow(colData) is not TRUE
How can I fix the problem?