kaito
September 11, 2022, 5:30am
1
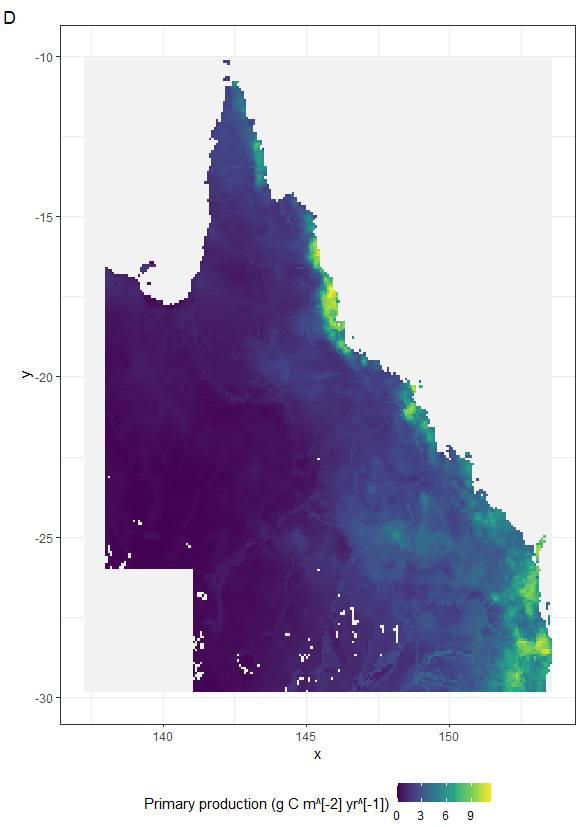
Need help making the superscripts for grams of carbon per meter squared per year (g C m yr).
pp_plot <- gplot(ras.stack[[5]])+
DavoWW
September 11, 2022, 7:10am
2
Hi @kaito ,
x_name <- c(expression(paste( "Primary production (g C m"^{"-2"},".yr"^{"−1"},")")))
plot(1,1, xlab=x_name)
Created on 2022-09-11 with reprex v2.0.2
Getting this to work correctly can be quite tricky. See help(plotmath).
kaito
September 11, 2022, 8:26am
3
Great that worked. Thank you so much!
system
October 2, 2022, 8:27am
4
This topic was automatically closed 21 days after the last reply. New replies are no longer allowed.