No x-labels on ggplot2 line

Hi people!

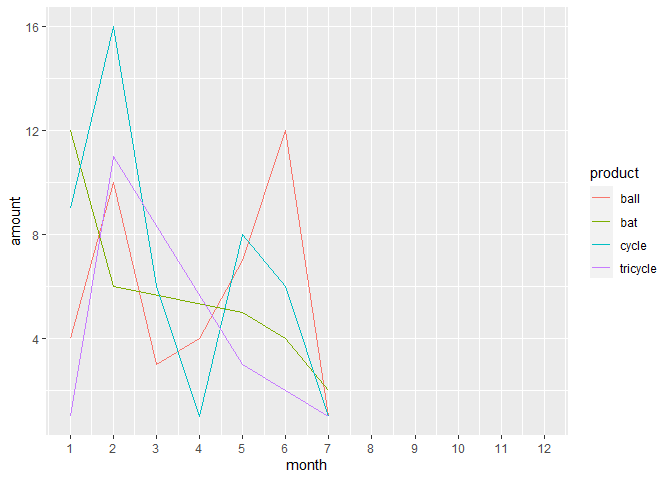
Finally I got some code plotting dates on x with a 1 till 12 scale.
Sadly the labels don't appear on the x-axis.

Can you please tell me how to force the labels to the x-scale?
The example dates start only on the first of each month. Real data can be any day within the months.
Smart date solutions are also very welcome. But main target is maintaining the 12 month scale.

Thank you.

library(tidyverse)

date <- c("03/01/2022","02/01/2022","01/01/2022","02/01/2022","01/01/2022",
          "07/01/2022","05/01/2022","07/01/2022","06/01/2022","03/01/2022",
          "02/01/2022","01/01/2022","07/01/2022","02/01/2022","01/01/2022",
          "05/01/2022","06/01/2022","06/01/2022","05/01/2022","02/01/2022",
          "01/01/2022","02/01/2022","02/01/2022","01/01/2022","05/01/2022",
          "06/01/2022","04/01/2022","03/01/2022","02/01/2022","01/01/2022",
          "02/01/2022","02/01/2022","05/01/2022","05/01/2022","06/01/2022",
          "05/01/2022","03/01/2022","02/01/2022","01/01/2022","02/01/2022",
          "01/01/2022","07/01/2022","05/01/2022","07/01/2022","06/01/2022",
          "03/01/2022","02/01/2022","01/01/2022","07/01/2022","02/01/2022",
          "01/01/2022","05/01/2022","06/01/2022","06/01/2022","05/01/2022",
          "02/01/2022","01/01/2022","02/01/2022","02/01/2022","01/01/2022",
          "05/01/2022","06/01/2022","04/01/2022","03/01/2022","02/01/2022",
          "01/01/2022","02/01/2022","02/01/2022","05/01/2022","05/01/2022",
          "06/01/2022","05/01/2022","05/01/2022","06/01/2022","04/01/2022",
          "03/01/2022","02/01/2022","01/01/2022","02/01/2022","02/01/2022",
          "05/01/2022","05/01/2022","06/01/2022","04/01/2022","03/01/2022",
          "02/01/2022","01/01/2022","02/01/2022","02/01/2022","05/01/2022",
          "05/01/2022","06/01/2022","04/01/2022","03/01/2022","02/01/2022",
          "01/01/2022","02/01/2022","02/01/2022","05/01/2022","05/01/2022",
          "06/01/2022")
amount <- c(1,1,0,1,1,1,1,0,8,1,1,1,1,1,1,1,2,1,1,1,8,1,1,1,1,1,1,1,1,1,1,1,
            1,1,1,1,1,1,1,1,1,1,1,1,1,1,2,1,1,1,1,1,1,1,1,9,1,1,1,1,1,1,1,1,
            1,1,1,6,1,1,1,1,1,1,1,1,1,1,1,1,1,3,1,1,1,1,4,1,1,1,1,1,1,1,1,1,
            1,1,1,1,1)
product <- c("cycle","ball","bat","tricycle","cycle","bat","ball","cycle",
             "ball","cycle","ball","bat","tricycle","cycle","bat","ball",
             "cycle","ball","cycle","ball","bat","tricycle","cycle","bat",
             "ball","cycle","ball","cycle","ball","bat","tricycle","cycle",
             "bat","ball","cycle","ball","ball","cycle","ball","bat",
             "tricycle","cycle","bat","ball","cycle","ball","cycle","ball",
             "bat","tricycle","cycle","bat","ball","cycle","ball","cycle",
             "ball","bat","tricycle","cycle","bat","ball","cycle","ball",
             "cycle","ball","bat","tricycle","cycle","bat","ball","cycle",
             "ball","bat","ball","cycle","ball","cycle","ball","bat",
             "tricycle","cycle","bat","ball","cycle","ball","cycle","ball",
             "bat","tricycle","cycle","bat","ball","cycle","ball","cycle",
             "ball","bat","tricycle","cycle","bat")

data <- data.frame(date, amount, product)
View(data)
data <-

aggregate(amount ~ date + product, data = data, FUN = sum, na.rm = TRUE)

ggplot(data,aes(x=date, y=amount, group=product))+
  geom_line(aes(color=product)) +
  scale_x_discrete(breaks = c(1,2,3,4,5,6,7,8,9,10,11,12), 
    labels= c("1","2","3","4","5","6","7","8","9","10","11","12"), 
    limits=c("01/01/2022","02/01/2022","03/01/2022","04/01/2022","05/01/2022",
             "06/01/2022","07/01/2022","08/01/2022","09/01/2022","10/01/2022",
             "11/01/2022","12/01/2022")) 

I suggest you turn the date column into numeric dates.

library(tidyverse)
library(lubridate)
#> 
#> Attaching package: 'lubridate'
#> The following objects are masked from 'package:base':
#> 
#>     date, intersect, setdiff, union
date <- c("03/01/2022","02/01/2022","01/01/2022","02/01/2022","01/01/2022",
          "07/01/2022","05/01/2022","07/01/2022","06/01/2022","03/01/2022",
          "02/01/2022","01/01/2022","07/01/2022","02/01/2022","01/01/2022",
          "05/01/2022","06/01/2022","06/01/2022","05/01/2022","02/01/2022",
          "01/01/2022","02/01/2022","02/01/2022","01/01/2022","05/01/2022",
          "06/01/2022","04/01/2022","03/01/2022","02/01/2022","01/01/2022",
          "02/01/2022","02/01/2022","05/01/2022","05/01/2022","06/01/2022",
          "05/01/2022","03/01/2022","02/01/2022","01/01/2022","02/01/2022",
          "01/01/2022","07/01/2022","05/01/2022","07/01/2022","06/01/2022",
          "03/01/2022","02/01/2022","01/01/2022","07/01/2022","02/01/2022",
          "01/01/2022","05/01/2022","06/01/2022","06/01/2022","05/01/2022",
          "02/01/2022","01/01/2022","02/01/2022","02/01/2022","01/01/2022",
          "05/01/2022","06/01/2022","04/01/2022","03/01/2022","02/01/2022",
          "01/01/2022","02/01/2022","02/01/2022","05/01/2022","05/01/2022",
          "06/01/2022","05/01/2022","05/01/2022","06/01/2022","04/01/2022",
          "03/01/2022","02/01/2022","01/01/2022","02/01/2022","02/01/2022",
          "05/01/2022","05/01/2022","06/01/2022","04/01/2022","03/01/2022",
          "02/01/2022","01/01/2022","02/01/2022","02/01/2022","05/01/2022",
          "05/01/2022","06/01/2022","04/01/2022","03/01/2022","02/01/2022",
          "01/01/2022","02/01/2022","02/01/2022","05/01/2022","05/01/2022",
          "06/01/2022")
amount <- c(1,1,0,1,1,1,1,0,8,1,1,1,1,1,1,1,2,1,1,1,8,1,1,1,1,1,1,1,1,1,1,1,
            1,1,1,1,1,1,1,1,1,1,1,1,1,1,2,1,1,1,1,1,1,1,1,9,1,1,1,1,1,1,1,1,
            1,1,1,6,1,1,1,1,1,1,1,1,1,1,1,1,1,3,1,1,1,1,4,1,1,1,1,1,1,1,1,1,
            1,1,1,1,1)
product <- c("cycle","ball","bat","tricycle","cycle","bat","ball","cycle",
             "ball","cycle","ball","bat","tricycle","cycle","bat","ball",
             "cycle","ball","cycle","ball","bat","tricycle","cycle","bat",
             "ball","cycle","ball","cycle","ball","bat","tricycle","cycle",
             "bat","ball","cycle","ball","ball","cycle","ball","bat",
             "tricycle","cycle","bat","ball","cycle","ball","cycle","ball",
             "bat","tricycle","cycle","bat","ball","cycle","ball","cycle",
             "ball","bat","tricycle","cycle","bat","ball","cycle","ball",
             "cycle","ball","bat","tricycle","cycle","bat","ball","cycle",
             "ball","bat","ball","cycle","ball","cycle","ball","bat",
             "tricycle","cycle","bat","ball","cycle","ball","cycle","ball",
             "bat","tricycle","cycle","bat","ball","cycle","ball","cycle",
             "ball","bat","tricycle","cycle","bat")

data <- data.frame(date, amount, product)
View(data)
#data <-
#  aggregate(amount ~ date + product, data = data, FUN = sum, na.rm = TRUE)
dataSumm <- data |> mutate(date = mdy(date), month = month(date)) |> 
  group_by(month, product) |> 
  summarize(amount = sum(amount)) 
#> `summarise()` has grouped output by 'month'. You can override using the
#> `.groups` argument.

ggplot(dataSumm,aes(x=month, y=amount, group=product))+
  geom_line(aes(color=product)) +
  scale_x_continuous(breaks = c(1,2,3,4,5,6,7,8,9,10,11,12),
                     limits = c(1,12)) 

Created on 2022-11-26 with reprex v2.0.2

1 Like

It's perfect. I see the labels can be changed from within scale_x_continuous() and that date can be any date.
Thank you very much!

This topic was automatically closed 7 days after the last reply. New replies are no longer allowed.

If you have a query related to it or one of the replies, start a new topic and refer back with a link.