Options is not being showed in selectInput

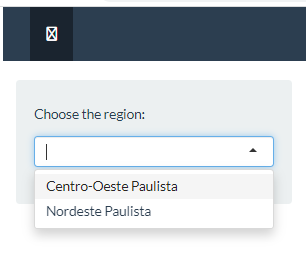
The options of my selectInput are not appearing. The options in this case are the regions of my df1 dataframe. For this reason, I am unable to generate maps in leaflet after the user selects a region in selectInput. What am I doing wrong?

library(shiny)
library(shinythemes)
library(dplyr)
library(leaflet)


function.test<-function(df1){
  
  df1<-structure(list(ETEs = c("Location1", "Location2", 
                               "Location3", "Location4", "Location5", "Location6", 
                               "Location7", "Location8"), Latitude = c(-22.8851078223344, 
                                                                                     -22.8315940282463, -22.9269302273894, -22.7168354545552, -22.4049856273179, 
                                                                                     -23.6335639883851, -23.8650940097111, -22.2258061474773), 
                      Longitude = c(-48.4939312250395,-48.4298167144681, -48.4594335076124, -48.5783308965308, 
                                    -48.1690878117765,-49.3218749756598, -48.0149391697704, -48.7246763738941), 
                      Region = c("Centro-Oeste Paulista", "Centro-Oeste Paulista", "Centro-Oeste Paulista", "Centro-Oeste Paulista", "Nordeste Paulista",
                                 "Nordeste Paulista", "Nordeste Paulista", "Nordeste Paulista")), row.names = c(NA, -8L), class = "data.frame")

  #GENERATE MAP
  
  plot1<- leaflet() %>%
      addMarkers(data = df1, lat = ~Latitude, lng = ~Longitude) 
     }
    
  return(list(
    "Plot1" = plot1
  ))
}


ui <- fluidPage(
  
  shiny::navbarPage(theme = shinytheme("flatly"), collapsible = TRUE,
                    br(),
                    tabPanel("",
                             icon= icon(" fa-project-diagram"),
                             sidebarLayout(
                               sidebarPanel(
                                 
                                 selectizeInput("hours",
                                                label = h5("Choose the region:"), choices = NULL,
                                                multiple = TRUE,
                                                options = list(maxItems = 1))),
                               mainPanel(
                                 tabsetPanel(id="tab",      
                                             tabPanel("Mapa",leafletOutput(outputId = "mapWarsaw", width = "100%", height = "600")))
                               )
                             )
                    )
  ))


server <- function(input, output,session) {
  
  df1_reactive <- reactive(function.test(df1))
  
  observe({
    updateSelectizeInput(session, "hours",
                         choices = unique(df1_reactive()$Region)
    )
  })

  output$mapWarsaw <- renderLeaflet({
  req(input$hours)
  df1_reactive()[[1]]
  
})
  
}

shinyApp(ui = ui, server = server)

It looks like df1 is defined within function.test(), so the selectInput can't find it. I've updated the code below to pull df1 out of the function and changed updateSelectizeInput() to look at it for choices instead of df1_reactive.

library(shiny)
library(shinythemes)
library(dplyr)
library(leaflet)


df1<-structure(list(ETEs = c("Location1", "Location2", 
                             "Location3", "Location4", "Location5", "Location6", 
                             "Location7", "Location8"), Latitude = c(-22.8851078223344, 
                                                                     -22.8315940282463, -22.9269302273894, -22.7168354545552, -22.4049856273179, 
                                                                     -23.6335639883851, -23.8650940097111, -22.2258061474773), 
                    Longitude = c(-48.4939312250395,-48.4298167144681, -48.4594335076124, -48.5783308965308, 
                                  -48.1690878117765,-49.3218749756598, -48.0149391697704, -48.7246763738941), 
                    Region = c("Centro-Oeste Paulista", "Centro-Oeste Paulista", "Centro-Oeste Paulista", "Centro-Oeste Paulista", "Nordeste Paulista",
                               "Nordeste Paulista", "Nordeste Paulista", "Nordeste Paulista")), row.names = c(NA, -8L), class = "data.frame")

function.test<-function(df1){
  #GENERATE MAP
  plot1<- leaflet() %>%
    addMarkers(data = df1, lat = ~Latitude, lng = ~Longitude) 
  
  return(list(
    "Plot1" = plot1
  ))
  }


ui <- fluidPage(
  
  shiny::navbarPage(theme = shinytheme("flatly"), collapsible = TRUE,
                    br(),
                    tabPanel("",
                             icon= icon(" fa-project-diagram"),
                             sidebarLayout(
                               sidebarPanel(
                                 
                                 selectizeInput("hours",
                                                label = h5("Choose the region:"), choices = NULL,
                                                multiple = TRUE,
                                                options = list(maxItems = 1))),
                               mainPanel(
                                 tabsetPanel(id="tab",      
                                             tabPanel("Mapa",leafletOutput(outputId = "mapWarsaw", width = "100%", height = "600")))
                               )
                             )
                    )
  ))


server <- function(input, output,session) {
  
  df1_reactive <- reactive(function.test(df1))
  
  observe({
    updateSelectizeInput(session, "hours",
                         choices = unique(df1$Region)
    )
  })
  
  output$mapWarsaw <- renderLeaflet({
    req(input$hours)
    df1_reactive()[[1]]
    
  })
  
}

shinyApp(ui = ui, server = server)

image

1 Like

Thanks so much @scottyd22!

This topic was automatically closed 7 days after the last reply. New replies are no longer allowed.

If you have a query related to it or one of the replies, start a new topic and refer back with a link.