Output a specific range of numbers per column at once

Hi, everyone.
i want to output specific range of numbers per column(col1,col2, col3 in dataframe c5), [0,5), [5,10), [10,15), [15,20). When[0,5), select the number in this range of every column to form a new dataframe(colnames is still col1,col2,col3). Because the number count in [0,5) may not be equal of every column,the new dataframe have NA. Similarly, [5,10), [10,15), [15,20) will also have corresponding dataframe. The new dataframe we may call nd1,nd2,nd3,nd4 or else. And then output all of them in a list is best. Now i can achieve by apply function for only one column. i want to know how to use loop function and output nd1,nd2, nd3, nd4 in a list at one time. i just practice the loop function recently.
Thank you in advance.

c1<-c(16.6,1.0,10.1,8.6,8.0,17.0,2.4,7.6,5.7,11.6,3.6,2.8,6.3,1.5,2.7,7.4,6.2,2.5,6.0,5.5,2.0,6.7,5.6,3.5,10.4,6.8,3.5,NA,NA)
c2<-c(9.3,10.6,1.3,2.8,5.8,NA,9.4,2.5,3.2,7.3,12.5,18.4,15.0,11.8,13.7,10.2,9.5,7.6,2.5,13.6,4.8,3.6,3.2,10.2,17.7,6.8,3.5,18.9,NA)
c3<-c(5.6,5.8,13.3,13.8,3.0,10.1,10.7,7.7,12.3,15.8,3.5,12.7,4.2,8.1,13.6,19.8,14.3,16.8,9.9,6.6,8.9,10.8,13.1,12.1,5.9,10.1,11.2,18.8,11.0)
c4<-c(1:29)
c5<-data.frame(c4,c1,c3,c2)
colnames(c5)<-c("id","col1","col2","col3")

Created on 2022-10-31 with reprex v2.0.2

Here is a general approach; define concrete variables from which you can compose any complex rule; then filter/apply the resulting rule; this can be used to create any one table; then we add another layer of indirection by iterating (mapping) over named functions representing the rule for each data set; and directly produced the name list result.

c5 <- data.frame(
  id = c(1L,2L,3L,4L,5L,6L,7L,8L,9L,10L,
         11L,12L,13L,14L,15L,16L,17L,18L,19L,20L,21L,22L,23L,
         24L,25L,26L,27L,28L,29L),
  col1 = c(16.6,1,10.1,8.6,8,17,2.4,7.6,5.7,
           11.6,3.6,2.8,6.3,1.5,2.7,7.4,6.2,2.5,6,5.5,2,6.7,
           5.6,3.5,10.4,6.8,3.5,NA,NA),
  col2 = c(5.6,5.8,13.3,13.8,3,10.1,10.7,7.7,
           12.3,15.8,3.5,12.7,4.2,8.1,13.6,19.8,14.3,16.8,9.9,
           6.6,8.9,10.8,13.1,12.1,5.9,10.1,11.2,18.8,11),
  col3 = c(9.3,10.6,1.3,2.8,5.8,NA,9.4,2.5,3.2,
           7.3,12.5,18.4,15,11.8,13.7,10.2,9.5,7.6,2.5,13.6,
           4.8,3.6,3.2,10.2,17.7,6.8,3.5,18.9,NA)
)

library(tidyverse)

my_rules <- list(
  nd1 =function(x) x >= 0  & x<5,
  nd2 =function(x) x >= 5  & x<10,
  nd3 =function(x) x >= 10  & x<15,
  nd4 =function(x) x >= 15  & x<20
)

(result_list <- map(my_rules,{
  ~mutate(c5, across(starts_with("col"),
   .x,
  .names = "rule_{col}"
)) |>
  rowwise() |>
  mutate(
    rules = any(c_across(
      starts_with("rule_")),
    na.rm = TRUE)
  ) |>
  filter(rules) |>
    select(id,starts_with("col"))
}))
1 Like

Thank you for your help.it seems very colse to what i thought.
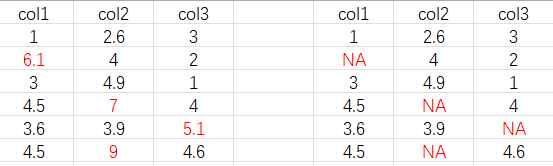
Actually, i want to retain the data in each column that belongs to[0,5). After being selected, the data in col1 is originally is still in col1, other colums are the same. And then form a new dataframe. However, take the result "nd1"as an example. In this dataframe, there are some values that do not fall within this range [0,5). For other ranges, it seems to have the same problem.
I am very sorry that some of the words were ambiguous to you, as my English is not very good.

c5 <- data.frame(
  id = c(1L,2L,3L,4L,5L,6L,7L,8L,9L,10L,
         11L,12L,13L,14L,15L,16L,17L,18L,19L,20L,21L,22L,23L,
         24L,25L,26L,27L,28L,29L),
  col1 = c(16.6,1,10.1,8.6,8,17,2.4,7.6,5.7,
           11.6,3.6,2.8,6.3,1.5,2.7,7.4,6.2,2.5,6,5.5,2,6.7,
           5.6,3.5,10.4,6.8,3.5,NA,NA),
  col2 = c(5.6,5.8,13.3,13.8,3,10.1,10.7,7.7,
           12.3,15.8,3.5,12.7,4.2,8.1,13.6,19.8,14.3,16.8,9.9,
           6.6,8.9,10.8,13.1,12.1,5.9,10.1,11.2,18.8,11),
  col3 = c(9.3,10.6,1.3,2.8,5.8,NA,9.4,2.5,3.2,
           7.3,12.5,18.4,15,11.8,13.7,10.2,9.5,7.6,2.5,13.6,
           4.8,3.6,3.2,10.2,17.7,6.8,3.5,18.9,NA)
)

library(tidyverse)

my_rules <- list(
  nd1 =function(x) x >= 0  & x<5,
  nd2 =function(x) x >= 5  & x<10,
  nd3 =function(x) x >= 10  & x<15,
  nd4 =function(x) x >= 15  & x<20
)

(result_list <- map(my_rules,{
  ~mutate(c5, across(starts_with("col"),
                     .x,
                     .names = "rule_{col}"
  )) |>
    rowwise() |>
    mutate(
      rules = any(c_across(
        starts_with("rule_")),
        na.rm = TRUE)
    ) |>
    filter(rules) |>
    select(id,starts_with("col"))
}))
#> $nd1
#> # A tibble: 19 × 4
#> # Rowwise: 
#>       id  col1  col2  col3
#>    <int> <dbl> <dbl> <dbl>
#>  1     2   1     5.8  10.6
#>  2     3  10.1  13.3   1.3
#>  3     4   8.6  13.8   2.8
#>  4     5   8     3     5.8
#>  5     7   2.4  10.7   9.4
#>  6     8   7.6   7.7   2.5
#>  7     9   5.7  12.3   3.2
#>  8    11   3.6   3.5  12.5
#>  9    12   2.8  12.7  18.4
#> 10    13   6.3   4.2  15  
#> 11    14   1.5   8.1  11.8
#> 12    15   2.7  13.6  13.7
#> 13    18   2.5  16.8   7.6
#> 14    19   6     9.9   2.5
#> 15    21   2     8.9   4.8
#> 16    22   6.7  10.8   3.6
#> 17    23   5.6  13.1   3.2
#> 18    24   3.5  12.1  10.2
#> 19    27   3.5  11.2   3.5
#> 
#> $nd2
#> # A tibble: 20 × 4
#> # Rowwise: 
#>       id  col1  col2  col3
#>    <int> <dbl> <dbl> <dbl>
#>  1     1  16.6   5.6   9.3
#>  2     2   1     5.8  10.6
#>  3     4   8.6  13.8   2.8
#>  4     5   8     3     5.8
#>  5     7   2.4  10.7   9.4
#>  6     8   7.6   7.7   2.5
#>  7     9   5.7  12.3   3.2
#>  8    10  11.6  15.8   7.3
#>  9    13   6.3   4.2  15  
#> 10    14   1.5   8.1  11.8
#> 11    16   7.4  19.8  10.2
#> 12    17   6.2  14.3   9.5
#> 13    18   2.5  16.8   7.6
#> 14    19   6     9.9   2.5
#> 15    20   5.5   6.6  13.6
#> 16    21   2     8.9   4.8
#> 17    22   6.7  10.8   3.6
#> 18    23   5.6  13.1   3.2
#> 19    25  10.4   5.9  17.7
#> 20    26   6.8  10.1   6.8
#> 
#> $nd3
#> # A tibble: 21 × 4
#> # Rowwise: 
#>       id  col1  col2  col3
#>    <int> <dbl> <dbl> <dbl>
#>  1     2   1     5.8  10.6
#>  2     3  10.1  13.3   1.3
#>  3     4   8.6  13.8   2.8
#>  4     6  17    10.1  NA  
#>  5     7   2.4  10.7   9.4
#>  6     9   5.7  12.3   3.2
#>  7    10  11.6  15.8   7.3
#>  8    11   3.6   3.5  12.5
#>  9    12   2.8  12.7  18.4
#> 10    14   1.5   8.1  11.8
#> # … with 11 more rows
#> # ℹ Use `print(n = ...)` to see more rows
#> 
#> $nd4
#> # A tibble: 9 × 4
#> # Rowwise: 
#>      id  col1  col2  col3
#>   <int> <dbl> <dbl> <dbl>
#> 1     1  16.6   5.6   9.3
#> 2     6  17    10.1  NA  
#> 3    10  11.6  15.8   7.3
#> 4    12   2.8  12.7  18.4
#> 5    13   6.3   4.2  15  
#> 6    16   7.4  19.8  10.2
#> 7    18   2.5  16.8   7.6
#> 8    25  10.4   5.9  17.7
#> 9    28  NA    18.8  18.9

Created on 2022-10-31 with reprex v2.0.2

Take the range[0,5) as an example too. it is probably helpful. Delete the red number and retain others, and then NA may occur. Thank you.
屏幕截图 2022-10-31 184856


library(tidyverse)

my_rules <- list(
  nd1 =function(x) ifelse(test = x >= 0  & x<5,yes = x,no=NA),
  nd2 =function(x) ifelse(test = x >= 5  & x<10,yes = x,no=NA),
  nd3 =function(x) ifelse(test = x >= 10  & x<15,yes = x,no=NA),
  nd4 =function(x) ifelse(test = x >= 15  & x<20,yes = x,no=NA)
)

(result_list <- map(my_rules,{
  ~mutate(c5, across(starts_with("col"),.x))
                     
}))
1 Like

Thank you, I will try to check this code to see why some values don't fall within corresponding range, when I learn more about R. I would be delighted if you could help me in the future.

This topic was automatically closed 7 days after the last reply. New replies are no longer allowed.

If you have a query related to it or one of the replies, start a new topic and refer back with a link.