Output Nice-Looking Formatted Tables

When I am generating output from an R Markdown document, I often want to output a table of numbers.

The suggestions for formatting tables in the Markdown cheatsheet all seem to be geared at model-output or statistical result-type tables. That's not what I need.

What I am looking for is a "presentation-friendly" table. More of a business application.

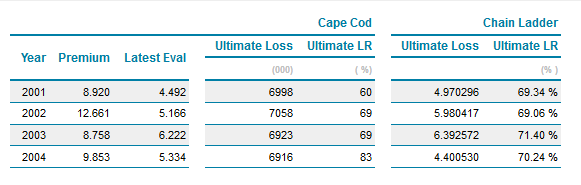
Something that makes it easy to define the format of each column (decimal places, commas, % signs, date formats, etc.) and that lets me define the borders (existence, size, colour) and shading of the tables and its cells. And the width of the table.

A typical example would be a table with 4 columns: Year/Quarter, Count, Amount, Percentage Change. Like 4-12 rows of data.

Does such a thing exist? Does anyone else have this problem, or is it just me? My current painful workaround is to copy the r output to the clipboard, paste into Excel, run a macro to format everything (or do it manually), save that as an image, then link the image into the Rmd file. Ick.

6 Likes

You could check out the xtable package if you are rendering to a pdf via latex. It is not the easiest package to use if you have never used it before, but once you get the hang of it, it is pretty flexible and allows you to format tables however you want.

1 Like

I REALLY like the kableExtra package. It leverages all the power of LaTeX (via bookmans) or HTML (via bootstraps) depending on your application in way that let's you get started very easily. It is the well documented and looks gorgeous.

http://haozhu233.github.io/kableExtra/

HTH,

Sam

3 Likes

I've been using kable from the knitr package and that is relatively easy to use and looks really nice in RMarkdown documents.

I use formattable to get percent signs in tables. The link to the page for
formattable is here. https://renkun.me/formattable/.

1 Like

huxtable and pixiedust are also good options for customizing tables. These use the same set of vommands to produce output in both LaTeX and HTML.

1 Like

At the rOpenSci unconf the group that made the packagemetrics :package: did a demo specifically on table-making packages (tableGallery) which is great! There's even an ultra-meta formattable table comparing package tables in the packagemetrics blog post.

David Hugh-Jones (author of huxtable) also did a great table comparing table-package features in the Design Principles, Comparisons and Limitations section of the huxtable docs!

(below is just a screenshot, definitely worth taking a look directly)

  • n.b. The tableGallery seems to have been moved here.
26 Likes

Great stuff here. I'm amazed at how many quality options there are. I've just been using knitr::kable for static tables and DT::datatable for interactive tables, but looks like I can pretty easily step up my game!

1 Like

There is also a the package flextable : Functions for Tabular Reporting • flextable
A real helper to format table for reporting with merge cells, header control, size cells control, ...
From dataframe in R workspace to this table formatted for reporting needs

image

2 Likes

Awesome stuff. Thanks. This is ultra helpful. Because as much as I try, I just can't make the knitr kable tables look like I want them too.

1 Like

Hey, @mara, just a note that the tableGallery link is not working anymore. Maybe that's intended, but just wanted to let you know! Bye

Thanks. Could you file an issue in the packagemetrics repo:

It looks like the files were moved, but the links were never updated. It looks like you can see the tableGallery here, now.

2 Likes

'k, issue submitted! And thanks for the correct link :grinning:

DT has quite a lot more features than listed in this table.

I suggest getting in touch with David Hugh-Jones. Certainly time for an update, especially given the release of 0.2.0 0.4.0. :flushed: If you know which features it has, though, I'm sure a PR would get things up to speed more quickly.

1 Like

I was just looking into it to try to make an exhaustive list of the features that are missing in the table to submit a PR :slight_smile:

1 Like

Awesome! Feature comparisons are so valuable (IMHO), and also can be so time consuming– especially since I usually end up switching things up only after getting frustrated spending hours trying to do x a different way in package y!

2 Likes