I'm learning how to use R Visualization and would like to create a ggplot of the palmerpenguins dataset but I am unable to get it onto my work. how do I go about it?
This is what I have done:
install.packages("tidyverse")
library("tidyverse")
install.packages("ggplot2")
library("ggplot2")
so how to i get the palmerpenguins dataset so i can create a ggplot from it?
Hi @Chemu , Welcome!
For use the palmerpenguins dataset you need to install the library palmerpenguins
# Install the palmerpenguins package
install.packages("palmerpenguins")
install.packages("ggplot2")

# Load the palmerpenguins package
library(palmerpenguins)
library(ggplot2)

# Access the palmerpenguins dataset
data(penguins)

# View the structure of the penguins dataset
str(penguins)

penguins
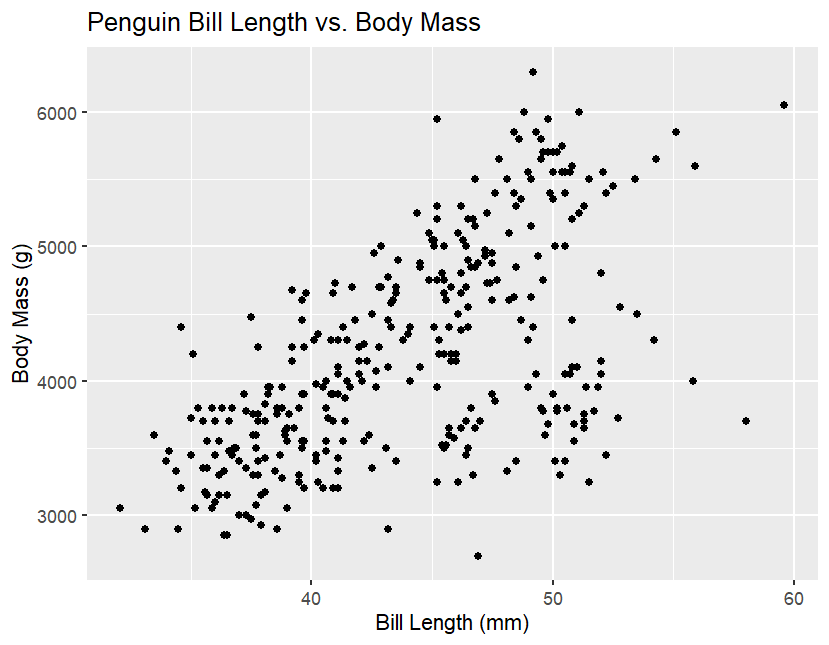
An easy sccater plot with ggplot:
ggplot(data = penguins, aes(x = bill_length_mm, y = body_mass_g)) +
  geom_point() +
  labs(x = "Bill Length (mm)",
       y = "Body Mass (g)",
       title = "Penguin Bill Length vs. Body Mass")
1 Like
After running the above code this is the feedback I have received:
ggplot(data = penguins, aes(x = bill_length_mm, y = body_mass_g)) +
- geom_point() +
- labs(x = "Bill Length (mm)",
-
y = "Body Mass (g)", -
title = "Penguin Bill Length vs. Body Mass")
Error in ggplot(data = penguins, aes(x = bill_length_mm, y = body_mass_g)) :
could not find function "ggplot"
You need to add
library(ggplot2)
to the script before calling ggplot(). You may need first to
install.packages("ggplot2")
1 Like
I finally got it, thank you.
This topic was automatically closed 21 days after the last reply. New replies are no longer allowed.
If you have a query related to it or one of the replies, start a new topic and refer back with a link.