Hi all, I hope you've all had a lovely Christmas!!
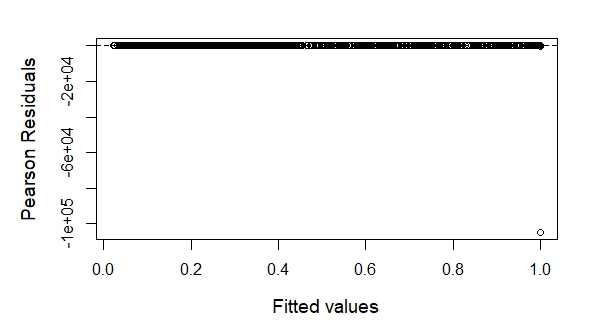
I'm trying to understand why my Pearson Residuals look wrong when I use a Bernoulli GLM. When I remove individual variables as outliers the residuals and cook's plot look great, however, at least one of the variables with outliers is going to be significant in my answer so I need to keep it in.
Can someone explain why my plot looks like this please and if I can just write something that will explain it? Such as I could not locate the exact outlier when looking at the dataset as a whole ......
Thank you so much