Performance attribution

Hi there,

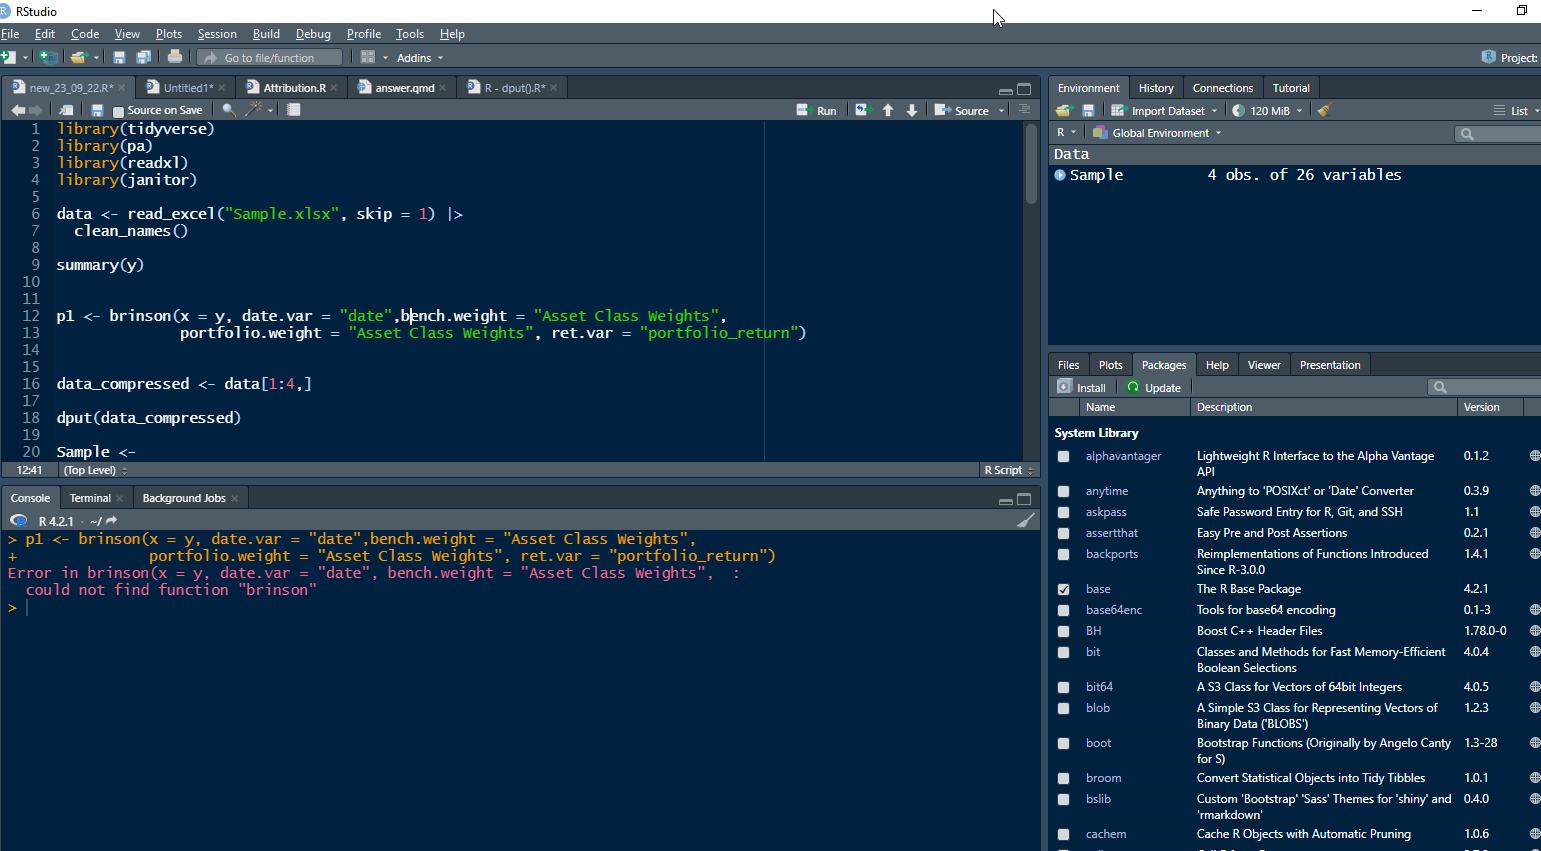
When i try to upload my own data set into pa package I am not able to call a Brison method. I have attached a screenshot. The package itself bundled with the data set "jan", "quarter" and "year", there is no problem in running the analysis using these data (jan) or data (year) but my own data "Sample.xlsx" didn't work in the same way. When I try to run I get the following error: Error in is.data.frame(x) : object 'Sample' not found.

Can anyone help me to clean up my data.

Here is the code for the first 4 lines

data <- structure( list( date = structure( c(1420070400, 1420156800, 1420243200, 1420329600), tzone = "UTC", class = c("POSIXct", "POSIXt") ), portfolio_return = c(0.0212, 0.019, 0.021, 0.03), australian_equities_3 = c(0.01, 0.02, 0.01, 0.01), domestic_fixed_interest_4 = c(0.02,-0.01, 0.02, 0.05), cash_equivalents_5 = c(0.03, 0.04, 0.03, 0.03), australian_equities_6 = c(0.28, 0.3, 0.3, 0.3), domestic_fixed_interest_7 = c(0.32, 0.3, 0.3, 0.3), cash_equivalents_8 = c(0.4, 0.4, 0.4, 0.4), total_weight_9 = c(1, 1, 1, 1), benchmark_return = c(0.0175, 0.0215, 0.032, 0.0381666666666666), australian_equities_11 = c(0.02, 0.01, 0.01, 0.00333333333333333), domestic_fixed_interest_12 = c(-0.01, 0.02, 0.05, 0.08), cash_equivalents_13 = c(0.04, 0.03, 0.03, 0.0233333333333333), australian_equities_14 = c(0.25, 0.25, 0.25, 0.25), domestic_fixed_interest_15 = c(0.35, 0.35, 0.35, 0.35), cash_equivalents_16 = c(0.4, 0.4, 0.4, 0.4), total_weight_17 = c(1, 1, 1, 1), allocation_australian_equities = c(7.5e-05,-0.000575,-0.0011,-0.00174166666666667), allocation_domestic_fixed_interest = c( 0.000824999999999999, 7.49999999999999e-05, -9e-04, -0.00209166666666667 ), allocation_cash_equivalents = c(0, 0, 0, 0), selection_australian_equities = c(-0.0025, 0.0025, 0, 0.00166666666666667), selection_domestic_fixed_interest = c(0.0105,-0.0105,-0.0105,-0.0105), selection_cash_equivalents = c(-0.004, 0.004, 0, 0.00266666666666668), interaction_australian_equities = c(-3e-04, 5e-04, 0, 0.000333333333333333), interaction_domestic_fixed_interest = c(-0.000899999999999999, 0.0015, 0.0015, 0.0015), interaction_cash_equivalents = c(0, 0, 0, 0) ), row.names = c(NA,-4L), class = c("tbl_df", "tbl", "data.frame") )

not surprisingly your data.frame does not contain anything called 'Sample' .
Does your data.frame contain a column that you wish to rename to be Sample ? or did you have Sample and lose it on the way ? Or perhaps your error is saying that you called a function on a Sample object; but your object is not called Sample, at least here when sharing it to us you called it data ; perhaps you made a similar mismatch in your code ?

Thank you for your reply. I don't know why you cannot see my Sample data. I have attached my own data and a screenshot with the following error: : Error in is.data.frame(x) : object 'Sample' not found.

I am sending again the code for the first lines. I have also attached a screenshot with an error message. Thank you.

Sample <-
structure(
list(
date = structure(
c(1420070400, 1420156800, 1420243200,
1420329600),
tzone = "UTC",
class = c("POSIXct", "POSIXt")
),
portfolio_return = c(0.0212, 0.019, 0.021, 0.03),
australian_equities_3 = c(0.01,
0.02, 0.01, 0.01),
domestic_fixed_interest_4 = c(0.02,-0.01,
0.02, 0.05),
cash_equivalents_5 = c(0.03, 0.04, 0.03, 0.03),
australian_equities_6 = c(0.28, 0.3, 0.3, 0.3),
domestic_fixed_interest_7 = c(0.32,
0.3, 0.3, 0.3),
cash_equivalents_8 = c(0.4, 0.4, 0.4, 0.4),
total_weight_9 = c(1, 1, 1, 1),
benchmark_return = c(0.0175,
0.0215, 0.032, 0.0381666666666666),
australian_equities_11 = c(0.02,
0.01, 0.01, 0.00333333333333333),
domestic_fixed_interest_12 = c(-0.01,
0.02, 0.05, 0.08),
cash_equivalents_13 = c(0.04, 0.03, 0.03,
0.0233333333333333),
australian_equities_14 = c(0.25, 0.25,
0.25, 0.25),
domestic_fixed_interest_15 = c(0.35, 0.35, 0.35,
0.35),
cash_equivalents_16 = c(0.4, 0.4, 0.4, 0.4),
total_weight_17 = c(1,
1, 1, 1),
allocation_australian_equities = c(7.5e-05,-0.000575,-0.0011,-0.00174166666666667),
allocation_domestic_fixed_interest = c(
0.000824999999999999,
7.49999999999999e-05,
-9e-04,
-0.00209166666666667
),
allocation_cash_equivalents = c(0,
0, 0, 0),
selection_australian_equities = c(-0.0025, 0.0025,
0, 0.00166666666666667),
selection_domestic_fixed_interest = c(0.0105,-0.0105,-0.0105,-0.0105),
selection_cash_equivalents = c(-0.004,
0.004, 0, 0.00266666666666668),
interaction_australian_equities = c(-3e-04,
5e-04, 0, 0.000333333333333333),
interaction_domestic_fixed_interest = c(-0.000899999999999999,
0.0015, 0.0015, 0.0015),
interaction_cash_equivalents = c(0,
0, 0, 0)
),
row.names = c(NA,-4L),
class = c("tbl_df", "tbl",
"data.frame")
)

ok, so you have a 4 row Sample data.frame ... now what code are you trying and failing to run against it ?

First i uplodaded the following libraries:
library(tidyverse)
library(pa)
library(readxl)
library(janitor)

Then i try to call to `brinson(). I use the following code:

Sample <- read_excel("Sample.xlsx", skip = 1) |>
clean_names()

summary(Sample)

p1 <- brinson(x = Sample, date.var = "date",bench.weight = "Asset Class Weights",
portfolio.weight = "Asset Class Weights", ret.var = "portfolio_return")

this doesnt appear in Sample though ?

Yes, you are right. I have to rearrange my Sample data according to brinson.
Here is the simple brinson analysis. If you run it you will get performance attribution result. I just want to replace data(jan) with my Sample data. I tried and couldn't. I would be very grateful if you could find the solution.

data(jan)

p1 <- brinson(x = jan, date.var = "date", cat.var = "sector",
bench.weight = "benchmark", portfolio.weight = "portfolio", ret.var
= "return")

summary(p1)

exposure(p1, var = "sector")

returns(p1)

plot(p1, var = "sector", type = "exposure")

plot(p1, var = "sector", type = "return")

So identify in your sample what are the columns that are the analogs of the ones in jan that are used in the brinson. I dont know your data (i dont have a particular interest in brinson either but was willing to helpnyou in an r technical sense), we havent yet identified a technical r problem, it seems a lack of knowledge about what are the requirements for the analysis is the sticking point.

Thank you for your comment. One more question. If i just simply run p1 <- brinson(x = Sample) the following error message is pop up:
Error in split.default(X, group) : first argument must be a vector. From a technical point of view what exactly should i change to fix this issue. Thanks

args(brinson)
function (x, date.var = "date", cat.var = "sector", 
          bench.weight = "benchmark", portfolio.weight = "portfolio", 
          ret.var = "return") 

i.e. if you don't pass cat.var, bench.weight ,portoflio.weight,ret.var as choices, then brinson will assume that the variables will be called sector , benchmark etc.
jan satisfies that, and your Sample violates that.
so have Sample conform to that... but this can't be done without thought and consideration.
Review the documentation and think about your data and what maps to what.

Thank you for your answer.

This topic was automatically closed 42 days after the last reply. New replies are no longer allowed.

If you have a query related to it or one of the replies, start a new topic and refer back with a link.