hello everyone.
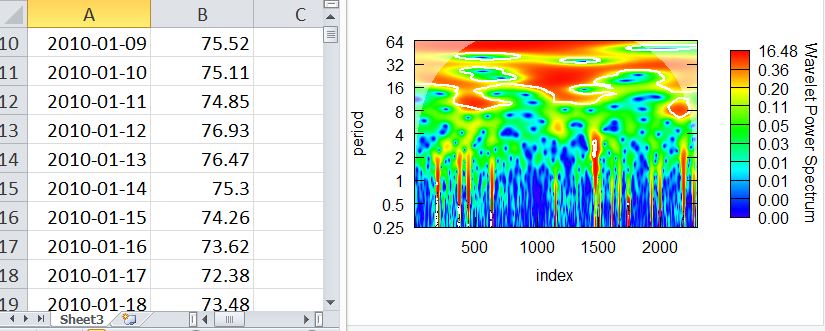
I am using below mentioned code to plot wavelet spectrum. I have 2299 daily data. But i am unable to get the years on X-axis. I am getting index instead of years.
#Wavelet Spectrum
library(WaveletComp)
library(readxl)
data <- read.table("C:/Users/faryal malaika/Desktop/wavelet stata graphs/data.txt", header = TRUE)
date <- as.Date(data$date)
data2<-data.frame(date=data, data$x)
my.w = analyze.wavelet(data2, "data.x",
loess.span = 0, dt = 1/12, dj = 1/250,
lowerPeriod = 0.250, upperPeriod = 64,
make.pval = T, n.sim = 10)
wt.image(my.w, color.key = "quantile", n.levels = 250,
legend.params = list(lab = "Wavelet Power Spectrum",
mar = 4.7, label.digits = 2, n.ticks=10),
show.date = T, date.format = "%Y-%m-%d",
timelab = "year", periodlab = "period")
I will highly be grate for your help. Please let me know how i can generate years on x axis in place of index. thanks