Hi everyone.
I’m a new R user and I’m now in the process of learning how to deal with regression models.
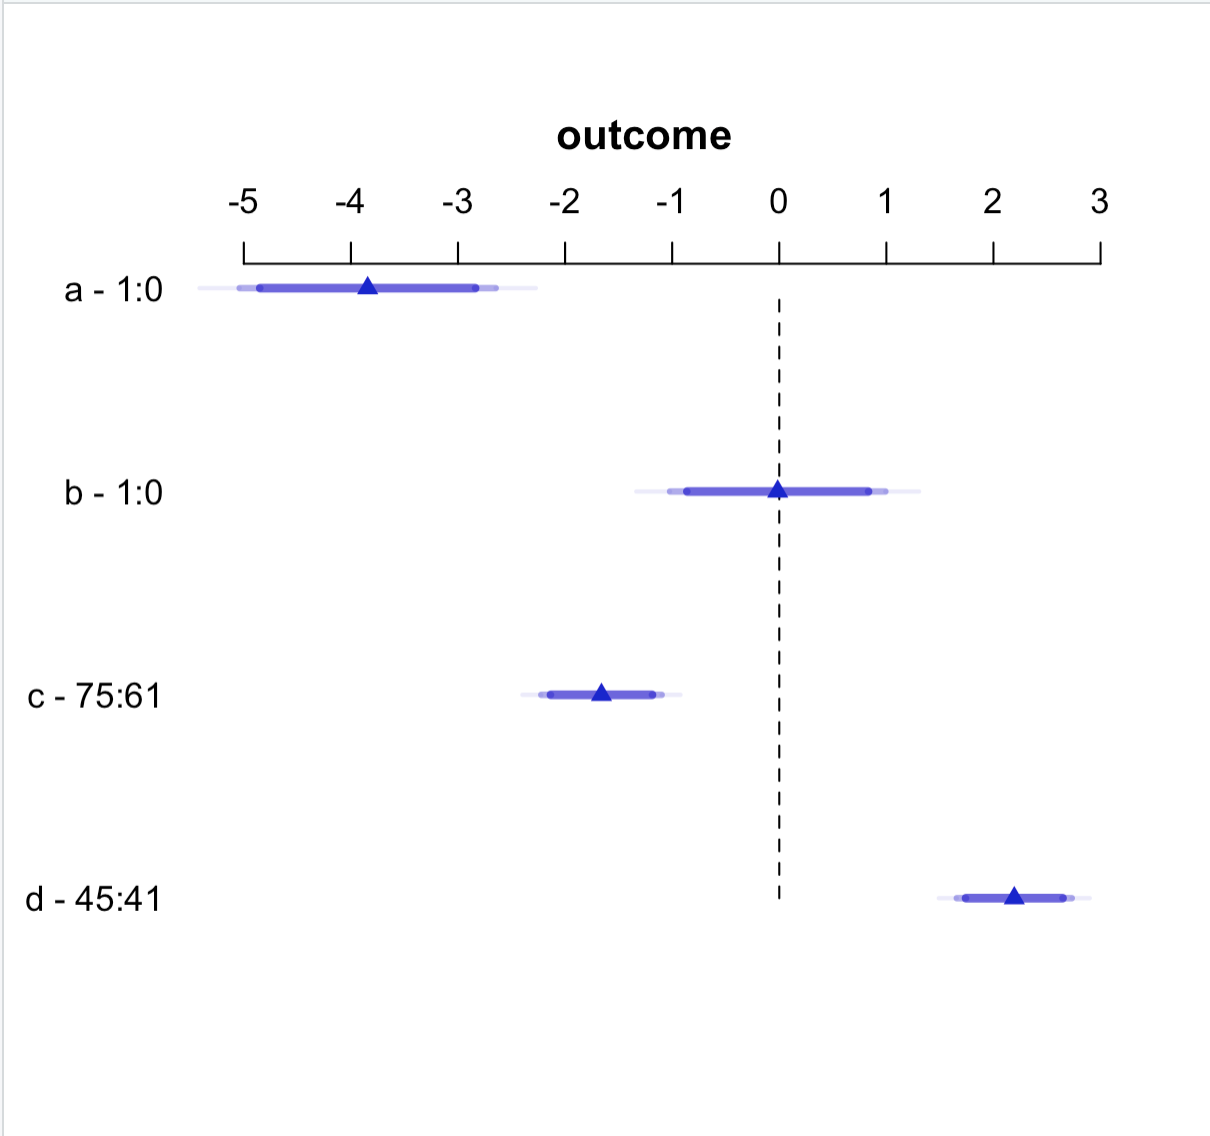
I need to plot the coefficients of a multivariate model and I learnt how to do it with the functions provided with rms package.
I’m not familiar with plot function but I was wondering whether there is a way to customise the appearance of the plot (changing the predictor labels, colours used for point estimates and confidence intervals and so on).
I thank you everyone and apologise for the silly question
model ← ols(outcome ~ a +
b +
c +
d, data = data)
plot(summary(model))