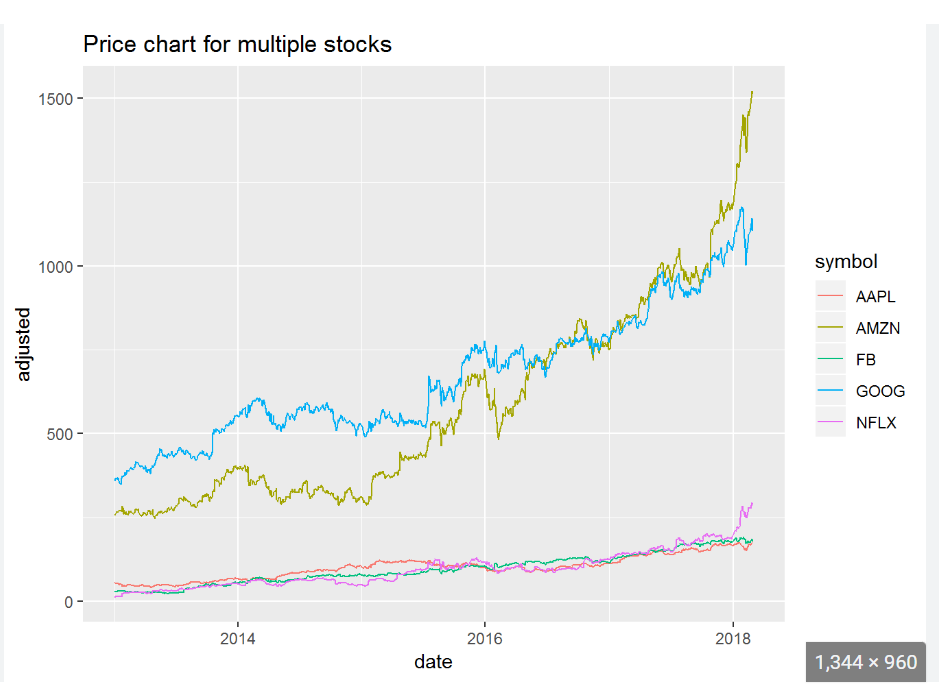
Hello everyone. I have a problem when trying to plot several stock prices in one single plot like the following plot.
However, it returns an error and I cannot fix it. Could anyone help me with it? Really appreciate it.
library(quantmod)
library(ggplot2)
library(magrittr)
library(broom)

start = as.Date("2013-01-01")
end = as.Date("2022-12-01")

symbols <- getSymbols(c("AAPL", "GOOGL", "MSFT","META", "AMZN"), src = "yahoo", from = start, to = end)

apple <- getSymbols(c("AAPL"), src = "yahoo", from = start, to = end)

stocks = as.xts(data.frame(A = AAPL[, "AAPL.Adjusted"],
                           B = GOOGL[, "GOOGL.Adjusted"],
                           C = MSFT[, "MSFT.Adjusted"],
                           D = AMZN[, "AMZN.Ajusted"],
                           E = META[,"META.Adjusted"]))


names(stocks) = c("Apple", "Google", "Microsoft","Meta", "Amazon")
index(stocks) = as.Date(index(stocks))

stocks_series = tidy(stocks) %>%

  ggplot(aes(x=index,y=value, color=series)) +
  labs(title = "Big Five Tech Companies: Daily Stock Prices January 2013 - Dec 2022",

       subtitle = "End of Day Adjusted Prices",
       caption = " Source: Yahoo Finance") +

  xlab("Date") + ylab("Price") +
  scale_color_manual(values = c("Red", "Black", "DarkBlue","Orange", "Green"))+
  geom_line()