My issues were all related to having had an older version of R and R studio installed.
I have drank the punch and have been converted.
I will be a faithful reprex user!
My issues were all related to having had an older version of R and R studio installed.
I have drank the punch and have been converted.
I will be a faithful reprex user!
Mara:
I was looking at this response again and I wanted to be sure that I now have it right so I will list in order, what should be done:
1.Install tidyverse
2.Copy R code to clipboard
3.Run the following code for Replex:
install.packages("callr", dependencies = TRUE)
library(ggplot2)
library(reprex)
reprex()
4.At this point the code is in reprex and can be copied into the post
Did I miss anything?
Thanks
So, if you haven't already installed the tidyverse, you won't be able to use it. However, you need to load/attach it inside of reprex with library(tidyverse) (or ggplot2, or whatever) in order for it to be self-contained. reprex::reprex() the function happens around your code. It's not part of the code for your reproducible example. I usually highlight the code in a script, and use the reprex add-in to render the selected code as a reprex, but if you copy your code to the clipboard and then run reprex() in the console, that works too.
The installation issues should be separate. The code you would want on your clipboard before running reprex would be something akin to the code portion of the reprex below:
library(ggplot2)
ggplot(iris, aes(Sepal.Width, Sepal.Length)) +
  geom_point()
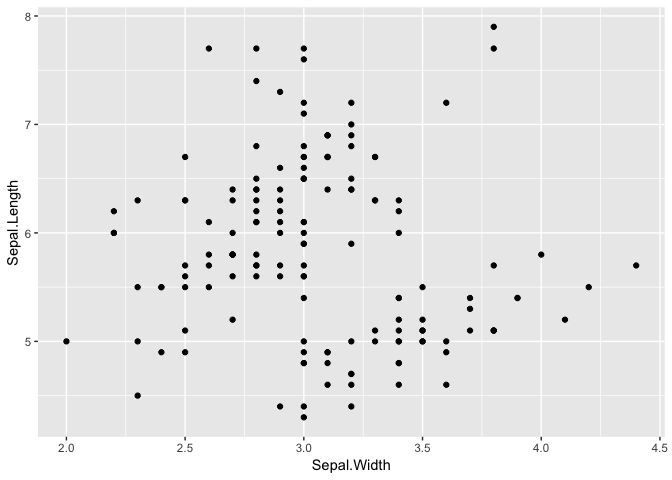
Created on 2018-10-02 by the reprex package (v0.2.1.9000)
I think that I have it now.
Thanks