Plot two time-series in the same plot

Hey everyone, I have the following problem:

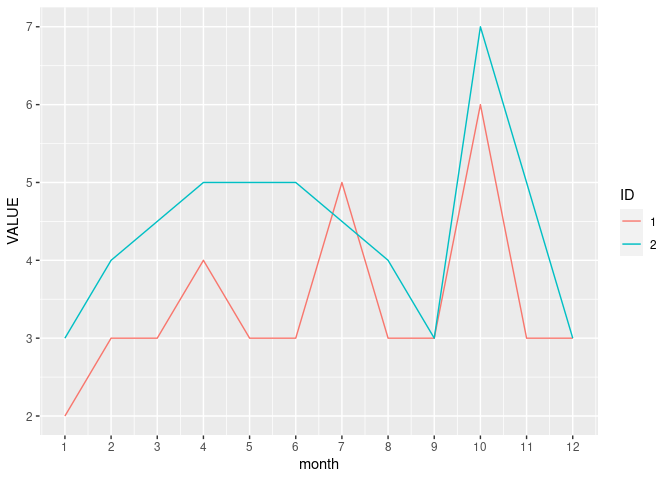
I want to plot ID=1 versus ID=2 in a line diagram with Month on the X-axises and Value on the Y-Axis. It doesn't work in the usual way described below. I think the problem is that I only have 9 observations for ID=2 and 12 for ID=1. One potential solution I came up with is to generate observations, so that I have 3 observations for ID=2 with missing values in the Value column. However, I cannot figure out how to code this. It would be grade to have a continuous line in the plot for ID=1 and a discontinuous line for ID=2, so that I can see for which month the data is missing.

df1 <- data.frame(ID = c(1, 1, 1, 1, 1, 1, 1, 1, 1, 1, 1, 1,
                         2, 2, 2, 2, 2, 2, 2, 2, 2),
                  MONTH = c('MONTH01', 'MONTH02', 'MONTH03', 'MONTH04', 'MONTH05','MONTH06',
                            'MONTH07','MONTH08','MONTH09','MONTH10','MONTH11','MONTH12',
                            'MONTH01', 'MONTH02', 'MONTH04','MONTH06',
                            'MONTH08','MONTH09','MONTH10','MONTH11','MONTH12'),
                  VALUE = c(2,3,3,4,3,3,5,3,3,6,3,3,3,4,5,5,4,3,7,5,3))

#what I tried:
library(ggplot2)
ggplot(df1, aes(MONTH),
       geom_line(aes(y=VALUE[ID==1])) +
         geom_line(aes(y=VALUE[ID==2])))

geom_line() is to be used with numeric variables only and MONTH is a categorical one so you need to convert it to numeric and then you can map other aesthetic (like color) to the ID variable to differentiate between the two groups. Take a look at this example:

library(tidyverse)

df1 <- data.frame(ID = c(1, 1, 1, 1, 1, 1, 1, 1, 1, 1, 1, 1,
                         2, 2, 2, 2, 2, 2, 2, 2, 2),
                  MONTH = c('MONTH01', 'MONTH02', 'MONTH03', 'MONTH04', 'MONTH05','MONTH06',
                            'MONTH07','MONTH08','MONTH09','MONTH10','MONTH11','MONTH12',
                            'MONTH01', 'MONTH02', 'MONTH04','MONTH06',
                            'MONTH08','MONTH09','MONTH10','MONTH11','MONTH12'),
                  VALUE = c(2,3,3,4,3,3,5,3,3,6,3,3,3,4,5,5,4,3,7,5,3))


df1 %>%
    mutate(month = as.integer(str_extract(MONTH, "\\d{2}$")),
           ID = as.factor(ID)) %>% 
    ggplot(aes(x = month, y = VALUE)) +
    geom_line(aes(color = ID, group = ID)) +
    scale_x_continuous(breaks = 1:12)

Created on 2023-01-19 with reprex v2.0.2

This topic was automatically closed 42 days after the last reply. New replies are no longer allowed.

If you have a query related to it or one of the replies, start a new topic and refer back with a link.