Hello,
I need some help producing values on x-axis by using ggplot
I got the graph perfectly, but u know on the x-axis I was trying to plot values but I am not getting it.

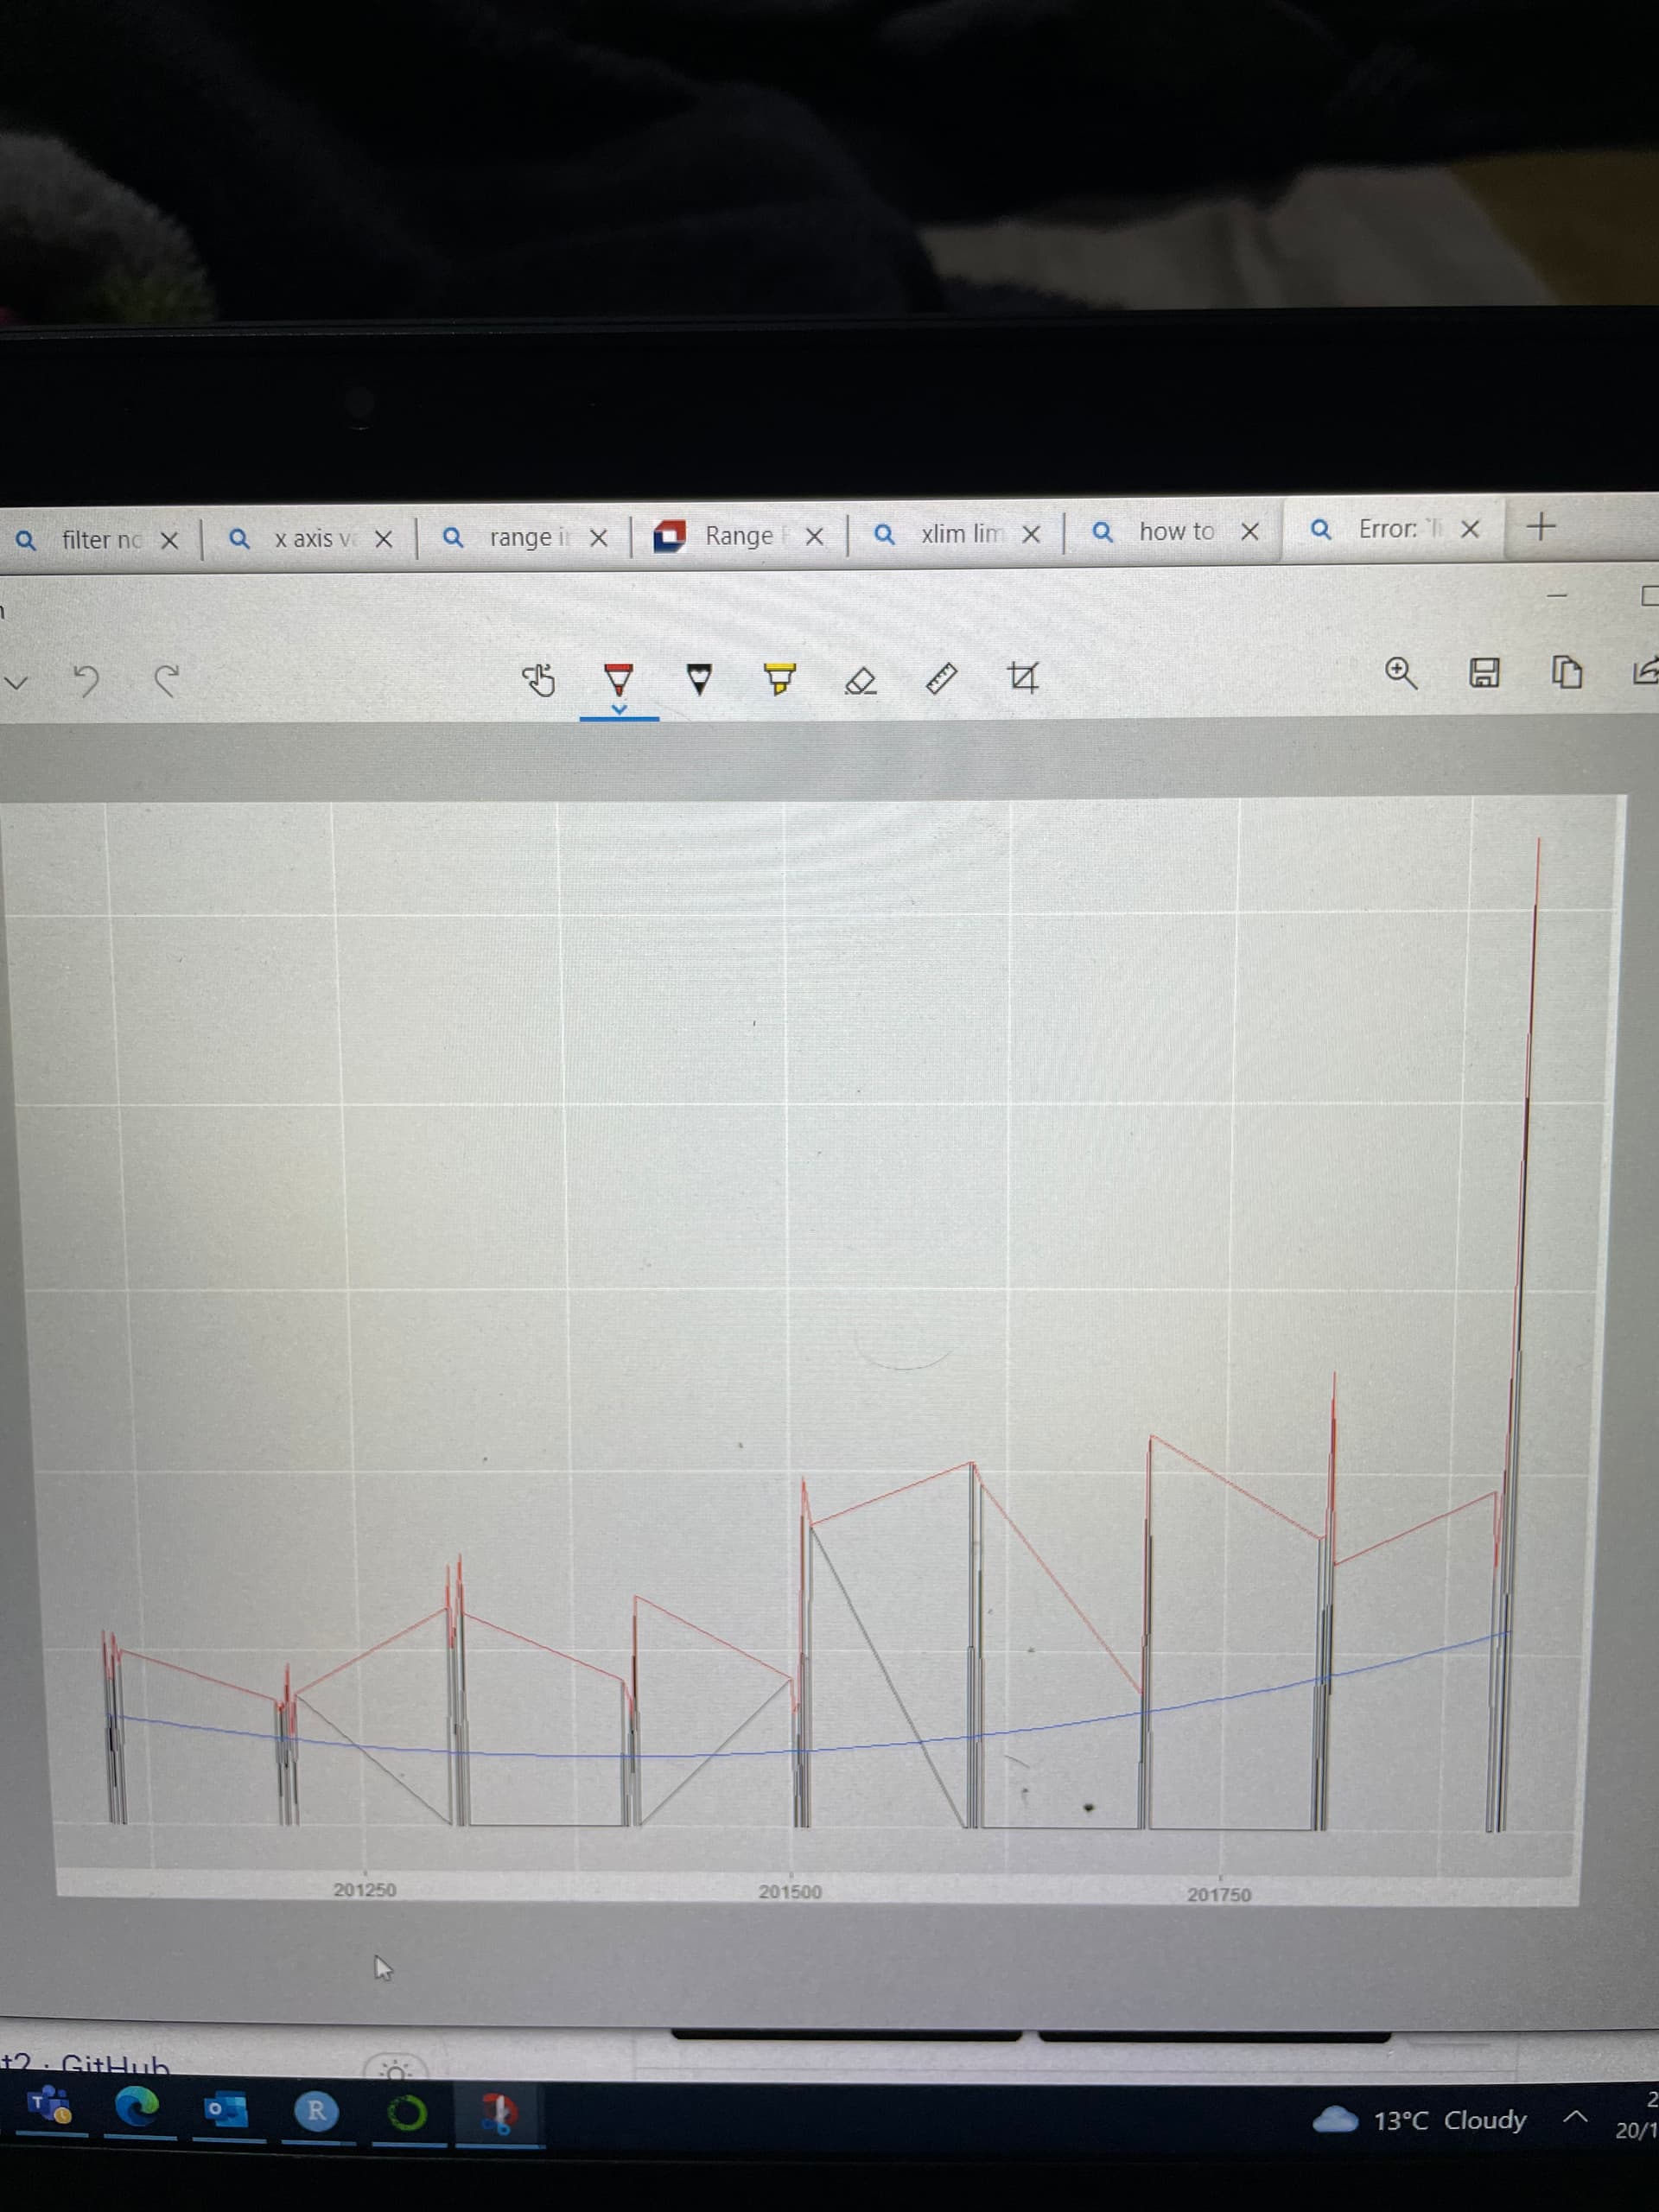
I need to plot perref column all values on X-axis
Hello,
I need some help producing values on x-axis by using ggplot
I got the graph perfectly, but u know on the x-axis I was trying to plot values but I am not getting it.
We would get a better chance to help if you could provide a minimal reproducible example, including some data and the code you've run so far, as described here: FAQ: How to do a minimal reproducible example ( reprex ) for beginners
From the looks of it you might just want to use geom_point() rather than geom_line(), but hard to tell from what you shared.
This topic was automatically closed 42 days after the last reply. New replies are no longer allowed.
If you have a query related to it or one of the replies, start a new topic and refer back with a link.