Hello,
I am dealing with a minor trouble using ggplot.
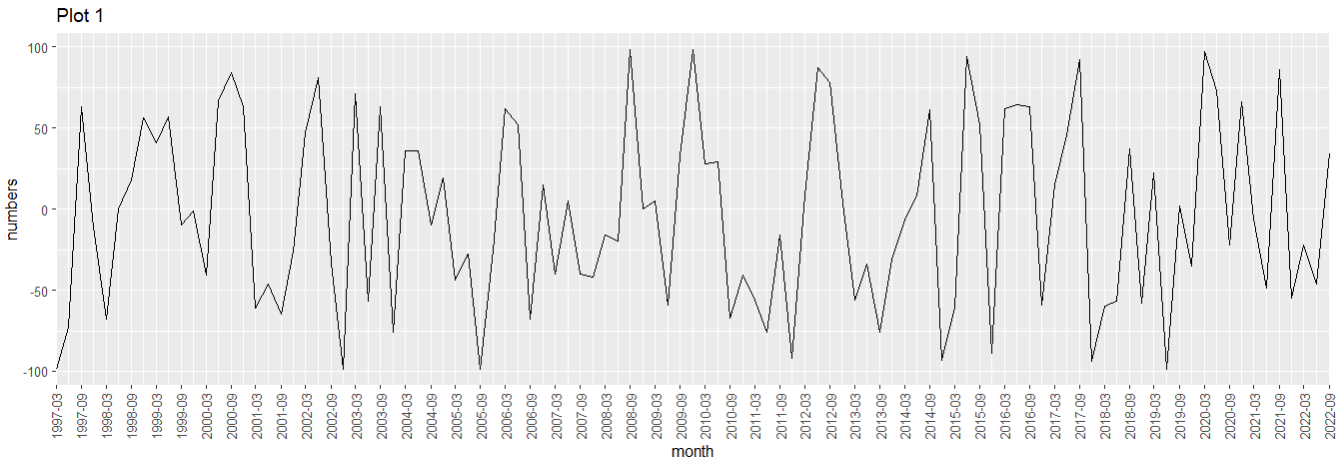
I need something as the plot will show you:
library(tidyverse)

fechas <- seq(as.Date("1997-03-01"), as.Date("2022-09-30"), by = "3 months")
valores <- sample(seq(from = -100, to = 100, by = 1), length(fechas), replace = TRUE)
data <- data.frame(fecha = fechas, values = valores)

data %>%
  ggplot(aes(x = fecha, y = valores)) +
  geom_line(color="black") +
  scale_x_date(date_labels = "%Y-%m", date_breaks = "6 month", limits = c(as.Date("1997-03-01"), as.Date("2022-09-01"))) +
  theme(axis.text.x = element_text(angle = 90, vjust = 0.5, hjust=1))+
  labs(title = "Plot 1 ", x = "month", y = "numbers")
However, I can't make the code showing on the X axis label starting from 1997-03-1 to 2022-09-30.
It's always showing dates with no data. The data is among 1997-03-1 and 2022-09-30, so there is no point in viewing 1995-05 or 2023-05...
As you can see, I try using the limits option inside scale_x_date, but It doesn't work.
As always, thanks for your time and interest.
Have a great week.