Plots not showing up in the 'plots' pane in RStudio - With R Markdown Notebook

Hi,
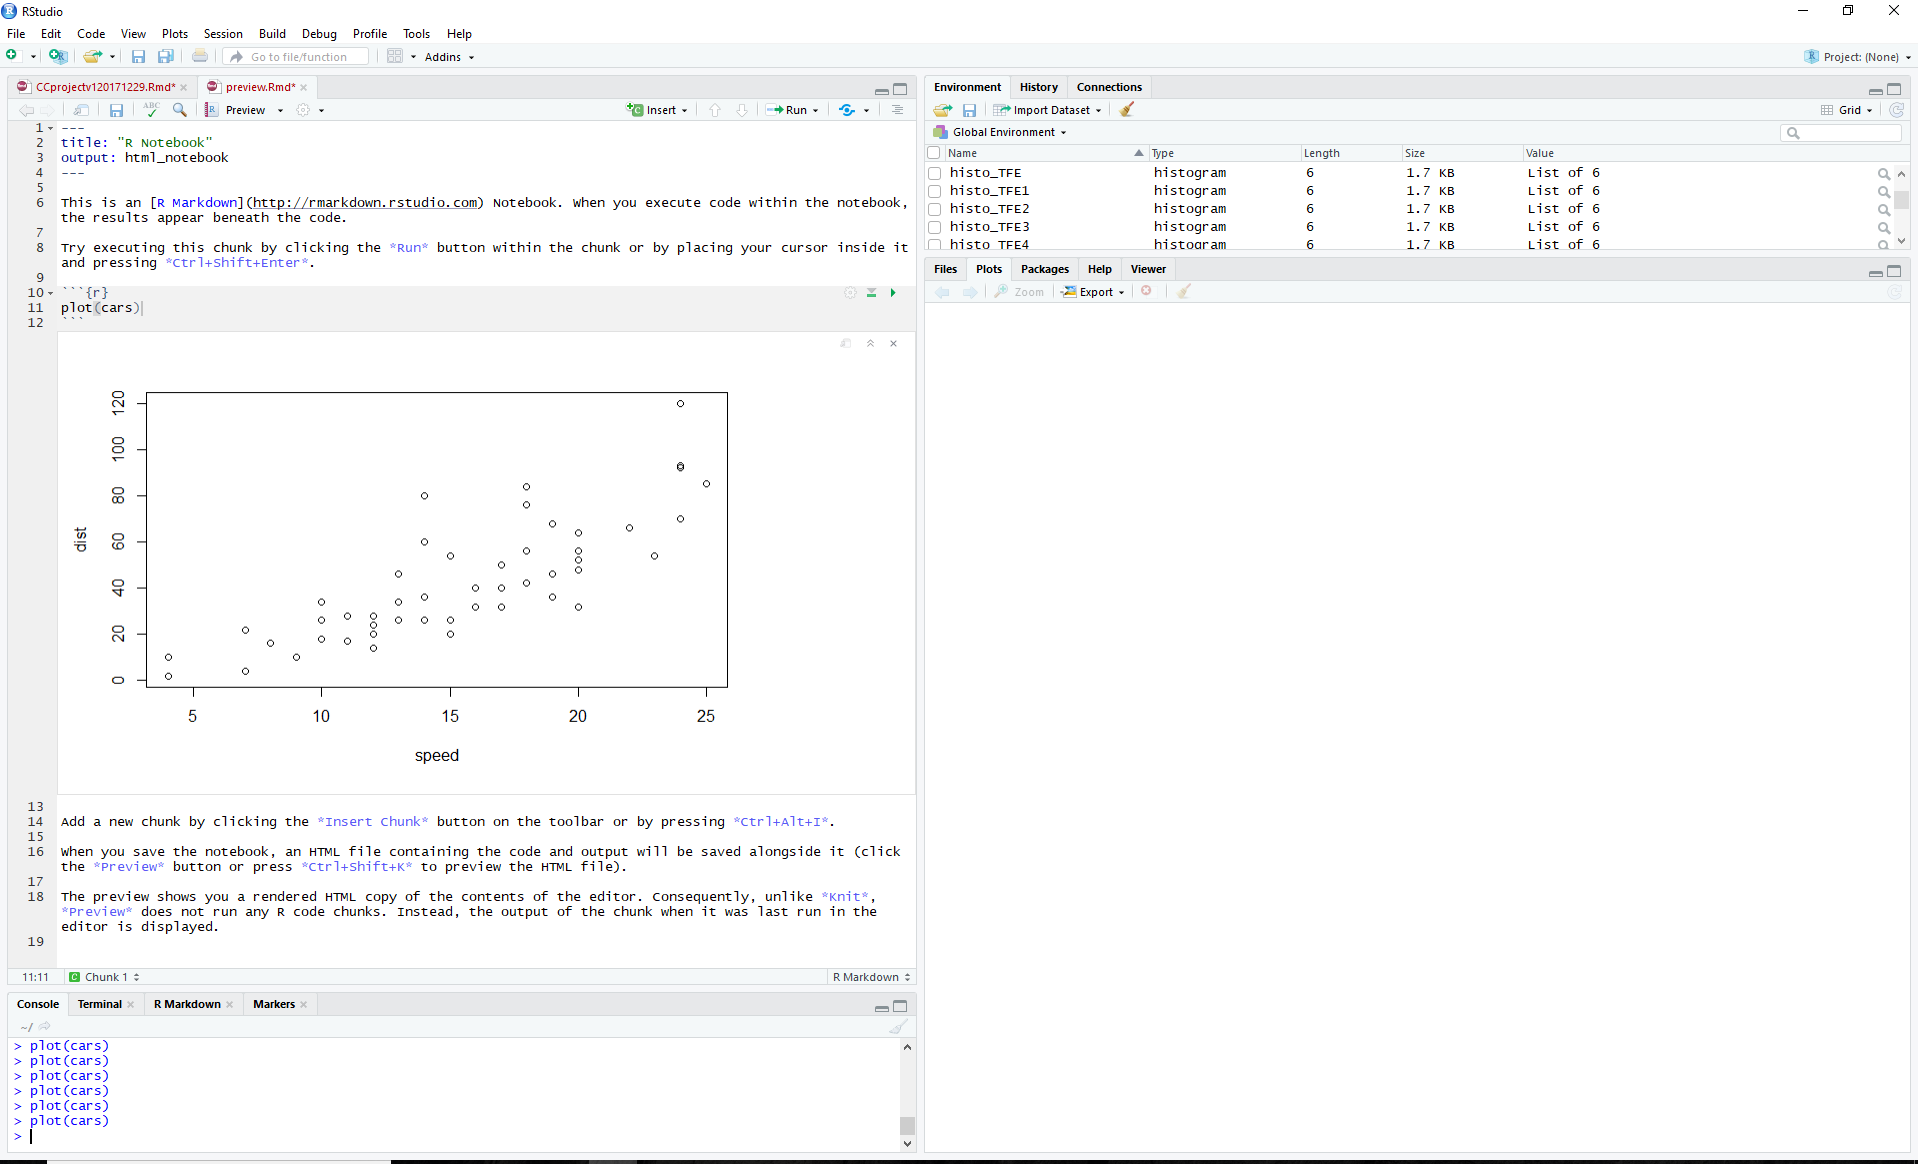
I'm hoping someone can assist. My plots are not showing up in the 'plots' area.

I have spent a good amount of time Googling the issue and have tried the following with no luck:

  • updated my RStudio Version (now Version 1.1.383) - 64 bit
  • dev.off()
  • while (!is.null(dev.list())) dev.off()
  • dev.cur() to close devices dev.off(i) with i being 2 devices
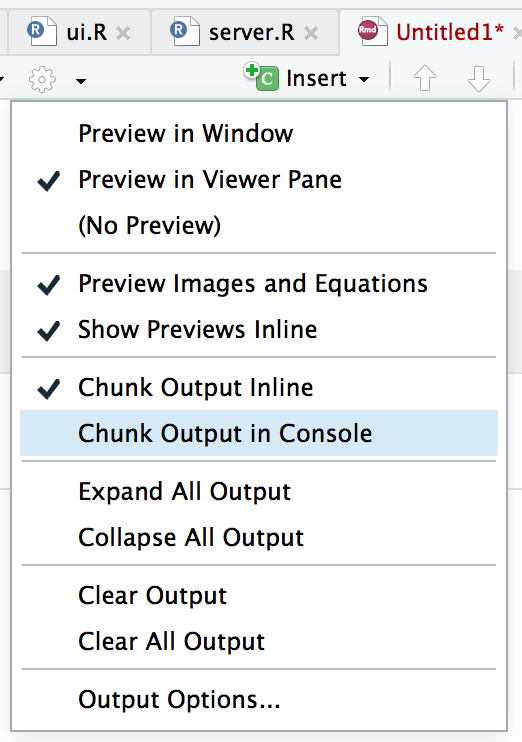
  • reviewed my Global Options of Rmarkdown and have selected: "Show output preview in" select "Viewer Pane" & Uncheck the box "Show output inline for all R Markdown documents"

I've rebooted/restarted multiple times.

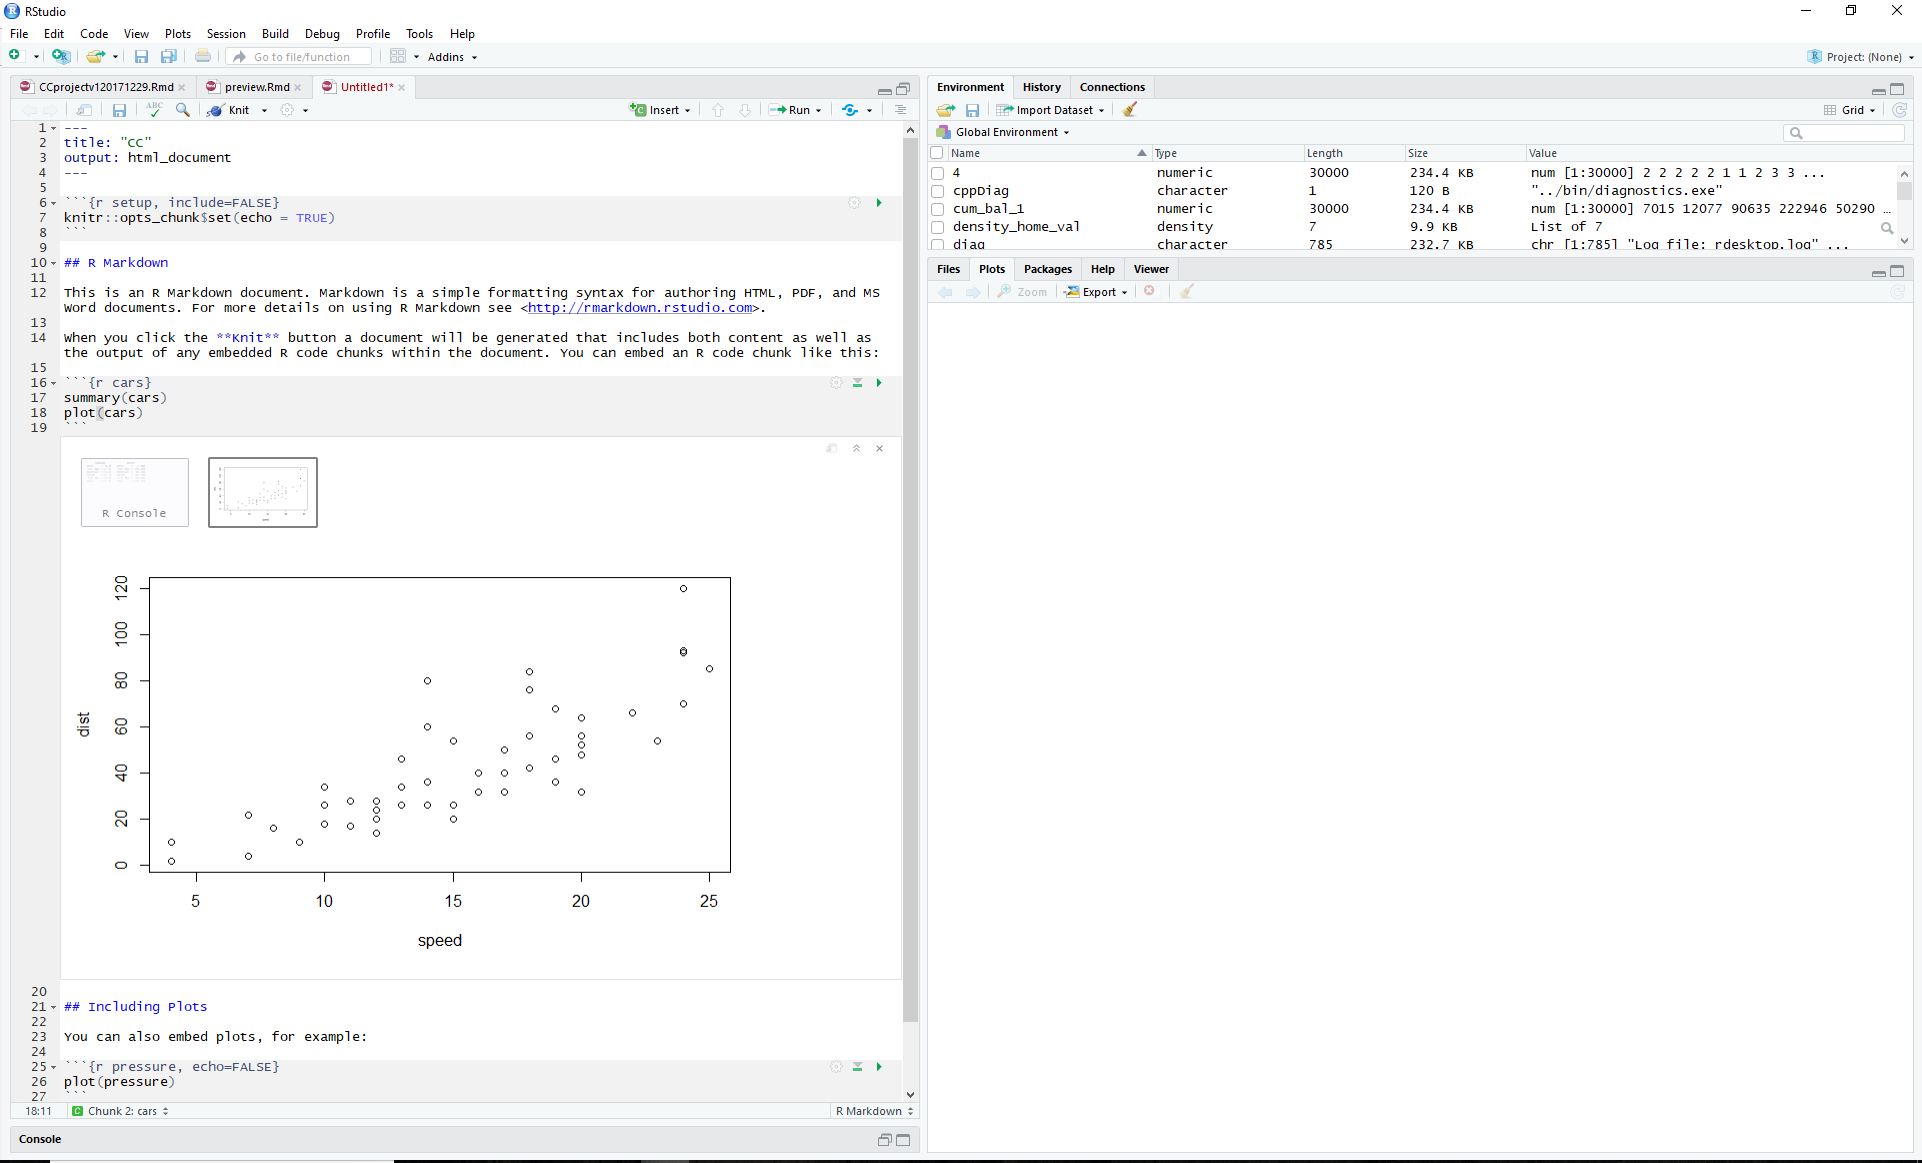
As a side note, my graphs will show up in the code area and when I paste the code into the Console area it will show up in the 'plots' area.

I'm hoping someone can help me save time in the constant copying and pasting...

Thank-you in advance.

In case it helps the diagnostics-report is as follows:
[1] "C:/Program Files/RStudio/bin/winutils"

$SESSIONNAME
[1] "Console"

$SystemDrive
[1] "C:"

$SystemRoot
[1] "C:\WINDOWS"

$TEMP
[1] "C:\Users\Chris\AppData\Local\Temp"

$TERM
[1] "xterm-256color"

$TMP
[1] "C:\Users\Chris\AppData\Local\Temp"

$TVT
[1] "C:\Program Files (x86)\Lenovo"

$USERDOMAIN
[1] "DESKTOP-U90BDSJ"

$USERDOMAIN_ROAMINGPROFILE
[1] "DESKTOP-U90BDSJ"

$USERNAME
[1] "Chris"

$USERPROFILE
[1] "C:\Users\Chris"

$VBOX_MSI_INSTALL_PATH
[1] "C:\Program Files\Oracle\VirtualBox\"

$windir
[1] "C:\WINDOWS"

[1] ".GlobalEnv" "package:ggplot2" "package:sm"
[4] "package:car" "package:PerformanceAnalytics" "package:xts"
[7] "package:zoo" "package:psych" "package:readxl"
[10] "tools:rstudio" "package:stats" "package:graphics"
[13] "package:grDevices" "package:utils" "package:datasets"
[16] "package:methods" "Autoloads" "package:base"
Log file: rdesktop.log

Can you share a short R Markdown document which reproduces the problem for you?

One thing to be aware of is that if your R Markdown document is a notebook (html_notebook) then it always shows output inline, regardless of your global preferences. If you would prefer to use the console, then use another output type, like html_document.

Finally, you can control the output type on a per-document level by using YAML:

---
...
editor_options: 
  chunk_output_type: console
----

Hi Jonathan,
I'm new to posting code to ask for assistance. I tried yaml with your code and it provides the error "Error: 'editor_options' not found'.

If I run 'plot(cars) the plot shows up but not in the 'plots' area. If I enter the same code in the Console, it will appears in the 'plots' area. However, I cannot get the plot to show up in the 'plots' area without having to enter it into the console area. .
Image:

The problem is at the top of your document; you're using the html_notebook output type. That output type will always have inline output.

If you want to use R markdown documents but don't want output inline, then choose a different R markdown document type. Try File -> New -> R Markdown -> Document. That should get you an html_document output type, which will follow your preferences for inline output.

Sorry, I got what you are saying now but it still doesn't produce the plot in the 'plots' area.

Inline output is the default for all R markdown types. So you'll still want to set your global option (as described above). If that isn't working, try this:

  1. Click on the gear button in the editor toolbar
  2. Click "Chunk Output in Console" from the list to check it

6 Likes

Ahh it worked!! Thank-you so much, you saved me endless hours and a lot of frustration!!

Great, glad to hear it!

I have a same problem. I can not see my plot in plot lane

If you want to use in RStudio Viewer or RMarkdown Notebook, use self_contained.

Set self_contained = TRUE inside the trelliscope code as shown below:

trelliscope(name = "city_vs_highway_mpg", self_contained = TRUE)

This worked for me like charm!