From the book "Practical Statistics for Data Science" this code appears: (the dataframe is kc_tax.csv ( kc_tax.csv.gz) in: practical-statistics-for-data-scientists/data at master · gedeck/practical-statistics-for-data-scientists · GitHub)
kc_tax0 <- subset(kc_tax, TaxAssessedValue < 750000 &
SqFtTotLiving > 100 &
SqFtTotLiving < 3500)
nrow(kc_tax0)
graph <- ggplot(kc_tax0, (aes(x=SqFtTotLiving, y=TaxAssessedValue))) +
stat_binhex(color='white') +
theme_bw() +
scale_fill_gradient(low='white', high='blue') +
scale_y_continuous(labels = function(x) format(x, scientific = FALSE)) +
labs(x='Finished Square Feet', y='Tax-Assessed Value')
graph
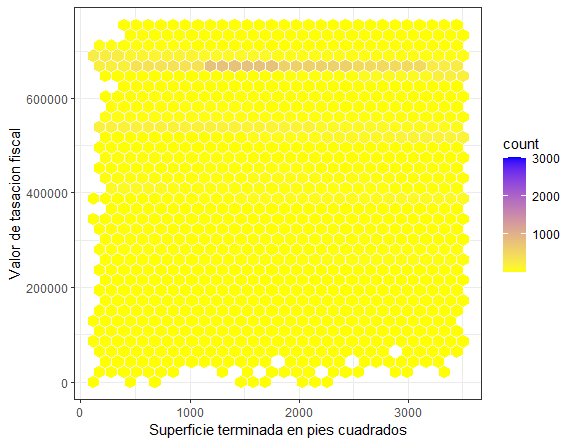
This flat plot appears: "HexPlotR.png"
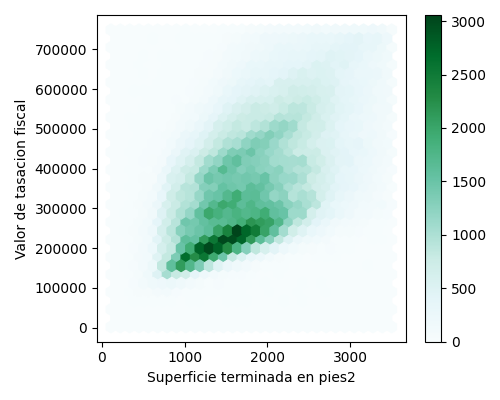
when something similar to this plot obtained in Python should appear: "HexPlotPython.png"
Any suggestions? I have tried many changes but I can not find the solution.
Thanks greetings