Hi Community !
I have a problem with my plot on my second axis. Could you helps me ? I share my code and a picture of my problem :
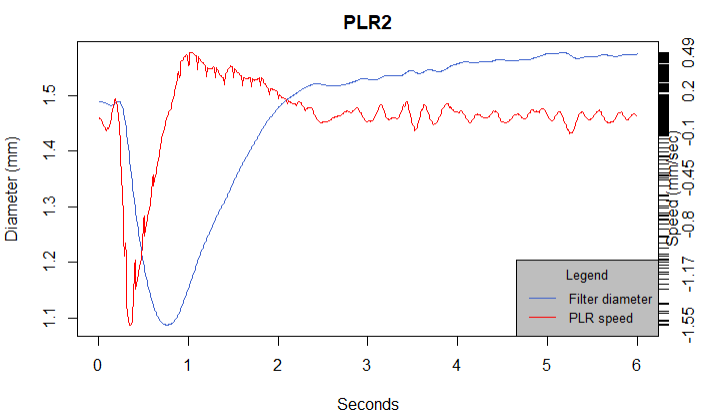
plot(PLR2$tempshertz, PLR2$diameter_filter , type="l" ,xlab="Seconds" , ylab="Diameter (mm)", main = "PLR2", col="royalblue3")
par(new = TRUE)
plot(PLR2$tempshertz , PLR2$vitesse_diam_filter, axes = FALSE , type = "l" , xaxt = "n", yaxt = "n" , col="red" , xlab = "" , ylab = "")
axis (side = 4, at= PLR2$vitesse_diam_filter, labels = round(PLR2$vitesse_diam_filter, digits =2))
mtext("Speed (mm/sec)" , side = 4 , line = 0.2)
par(mar=c(0,10,10,0))
legend("bottomright", legend=c("Filter diameter", "PLR speed"),
       col=c("royalblue3", "red"), lty=1:1, cex=0.8, title="Legend", bg='grey')
You can see on the right axis I have a lot of lines. I don't know how I can correct that. And when I want change the position of the second axis title (example with "line = 2"), my title is to much on the righ and it disapears.
Anyone have a solution please ?
Yours sincerely,