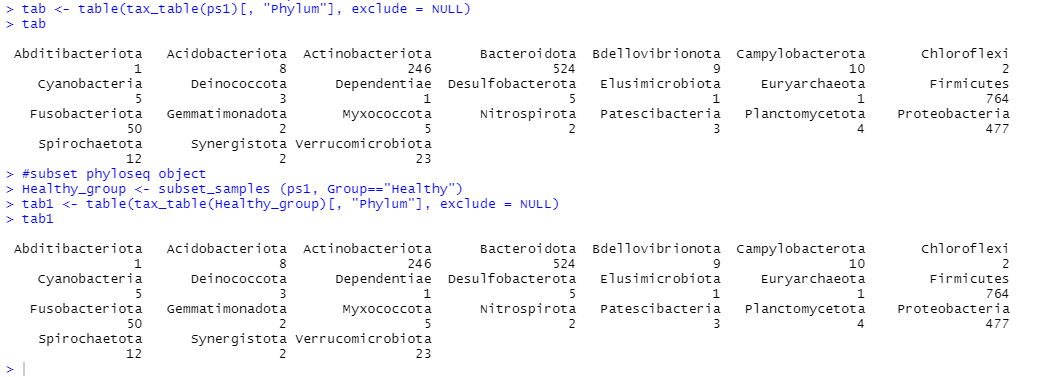
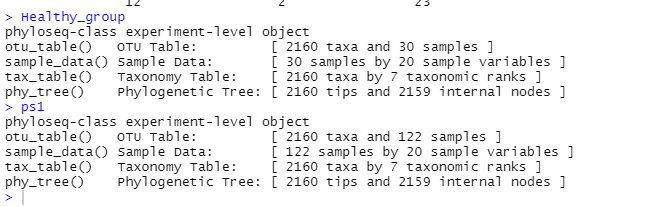
Hello everyone! I'm trying to create a table with relative abundance of phyla and genre by groups of patient I have in my dataset. The groups are HPV, CT, and healthy. The problem is when I subset my phyloseq object "ps1" by group I get the same results. Like there is no difference in the number of phyla in ps1 and e.g. the healthy group. I'm going to leave the code and the output below. The healthy group is composed of
The code:
tab <- table(tax_table(ps1)[, "Phylum"], exclude = NULL)
They have the same taxa number. Btw it's the same result for the other 2 groups.
Can someone please help me out? I don't know what I'm doing wrong.
Thank you!
Yes, I wanted to compare phylum abundance between different groups. But I get the same result everytime. I'll try to post a reproducible example. Thank you.