Thanks for sharing this resource. However I believe the data I have currently would be easier to show as count itself instead of calculating it and turning it to % after I tried to do it with the reference you provided.
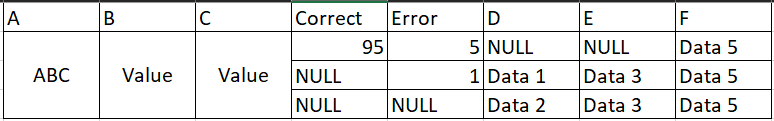
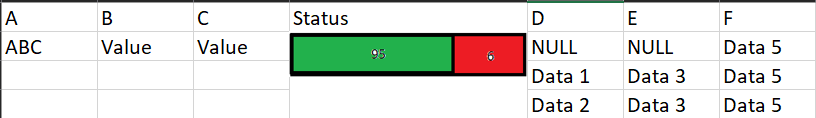
So the green part of the progress bar would be addition (sum) of values in the correct column in the raw data and the red part would be the addition (sum) of values in the error column in the raw data
I am not able to find any R resource reference for this implementation. Can you please help me?
If you are making tables and want jazzy formatting , try using either gt or DT packages, they both support HTML, so if you know how to style with HTML you can achieve many effects
Hi @nirgrahamuk, I am trying to use the following format but for some reason I do not see it in my final table in the UI. There is no coloring just the text that comes from the dataframe
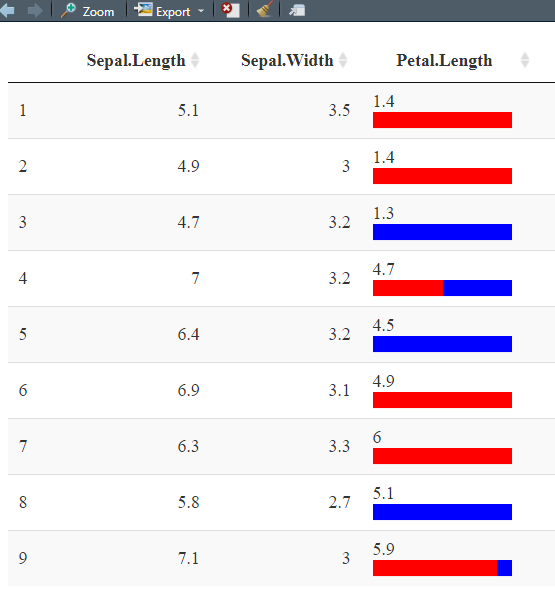
Hi @nirgrahamuk , I could make it work in the standalone script. However,
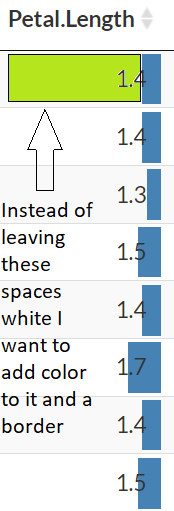
Currently the height of the colorbar is covering the whole height of the cell in the datatable instead I am interested in reducing the height of the color is it possible to do that?
I am also interested in adding a different color for the remaining white space and border for the color bar can we do that as well with this implementation?
given you want heavy customisations, in your shoes I wouldnt use any of these styling functions; but rather craft your own HTML/CSS and use in the table cells.
Can you help with examples I am not familiar with crafting HTML/CSS formatting for such implementation. I know you mentioned this before as well but if you could help with examples maybe it would make more sense by putting code to visuals