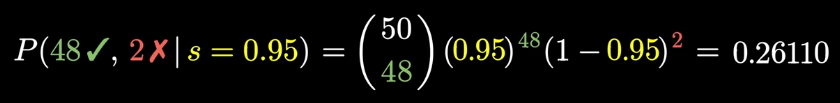
what you have inserted is just a usual binomial distribution and not a typical conditional distribution. So your given formula is just the probability of drawing 48 successes out of 50 trials, with a probability of success equal to 0.95.
In this case, suppose a random variable X with X \sim Bin(50,0.95). Then, you would like to know the probability of P(X = 48). This is nothing else than the probability density function of X at the point X = 48 (e.g. f_X(48)), which can be calculated in R with the command dbinom():
As @nirgrahamuk mentioned, here is no simulation involved (and not needed), since it is straight up stochastics. If you want to know more about the Binomial distribution, you may want to visit Binomial distribution - Wikipedia.
I can see it now, that there are "x" argument and "size" argument.
How do I know that x here should be 48 ?
What does it mean size=50 in the context of that total number of reviews (sample size) is 50 ?
Is a "size" a number of trials ?
For example, we have 100 students throwing a coin 5 times (each student), what is the probability of getting heads ?
Or we have 5 student throwing coins 100 times (each student), what is the probability of getting tails ?
Is a "size" argument a number of a single throw of a coin ?
Is a "n" a number of students ?
This is a bit complicated and with rbinom we have got additionally n and p arguments.
I was thinking that this is not very intuitive naming but rather confusing:
Your original question is about the basics of probability theory/statistics. The function used here, dbinom, stands for d istribution function of the binom ial distribution. Likewise there are qbinom (quantile function or generalized inverse), rbinom (random draws from specified binomial distribution) and pbinom(the value of the cumulative distribution function or sometimes called probability mass function).
So you basically have to understand the basics of statistics, like discrete and continuous distributions, what kind of distribution functions do exist and what are different types of distributions. If you know about different distributions, you will be able to come up with solutions for the questions below (in this case knowledge about binomial distribution).
Good luck on your further adventure throughout the world of statistics and probabilites
I know these functions and their variants for specific distributions. I still need an answer to my previous post, please and for that I will be very grateful.
I think you refer to the questions about the arguments, rather than your ambigous example questions. Regarding dbinom(), size means the number of trials (since in a binomial setting, you have n trials) and x refers to the number of successful trials. The argument prob means the probability of success. In your initial question, you basically asked for "What is the probability of 48 out of 50 trials being successful, if the probability to be successful is equal to 95%?".
In rbinom() you want to simulate random outcomes of a given binomial distribution. Here, the argument n is equal to the number of simulations (e.g. 5 means you want to repeat the random drawing 5 times), the argument size refers to the number of trials (as stated by the documentation) and prob is again the probability for success. So say you want to know how often there is heads, if 5 students each throw a coin 100 times. Then you can do this with rbinom() as follows:
Here, student 1 had 44 times heads (or tails, if you treat success as tails, whatever pleases you) and so on. That's all about rbinom() basically.
Your example questions are ambigous in my opinion, since they are not fully clear. Take the first one
This would require 100 observations of the results, which we don't have. If you have those observations, you will have to use a statistical test to verify, that the coin doesn't have a 50:50 chance to throw heads or tails. But you won't be able to obtain the correct probability of the coin, since in hypothesis testing there is only significant rejection, not confirmation.
Maybe this helped you to understand the function arguments of dbinom() and rbinom() a bit better.
Indeed, so is my interpretation correct:
I have got here 100 students throwing a coin 5 times (or throwing 5 independent coins once each ?) and as result I got:
that probability of getting heads(success) for first student is 2 out of 5 is 0.4 so 40%, for the second student that would be 3/5 = 0.6 meaning 60% and so on and on. Is it correct ?
You have 100 students, the first student is 2 out of 5 coins landing one way rather than the other, the proportion of that students flips one way rather than the other is 2/5 or 40%. the probability of tossing a coin and having it land a particular way was set by you when you did prob=0.5
To summarise, this analysis does not support an assertion such that there is a 40% probability of the first student getting 2 out of 5, it says that having done a simulation of the students activities, these are the results . if you did another simulation, you might get the same or different.
Thank you very much again to both of you for your kind explanations and patience.
I found an interesting collection of probability puzzles with solutions, for example:
"Five foxes and seven hounds run into a foxhole. While they're inside they get all jumbled up, so that all orderings are equally likely.
The foxes and hounds run out of the hole in a neat line. On average, how many foxes are immediately followed by a hound?"
thats how r plot works, if you only give it one variable, it assumes its the y variable and it should use the indexes of that variable to form the x axis.
you can do