R plots show in separate window (Quartz?)

Hello,
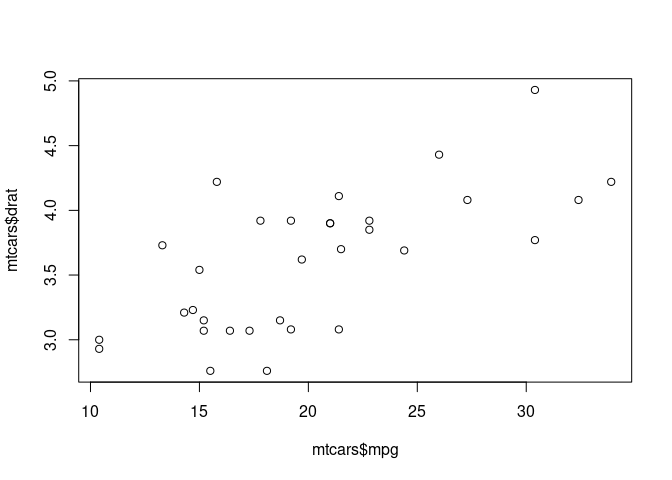
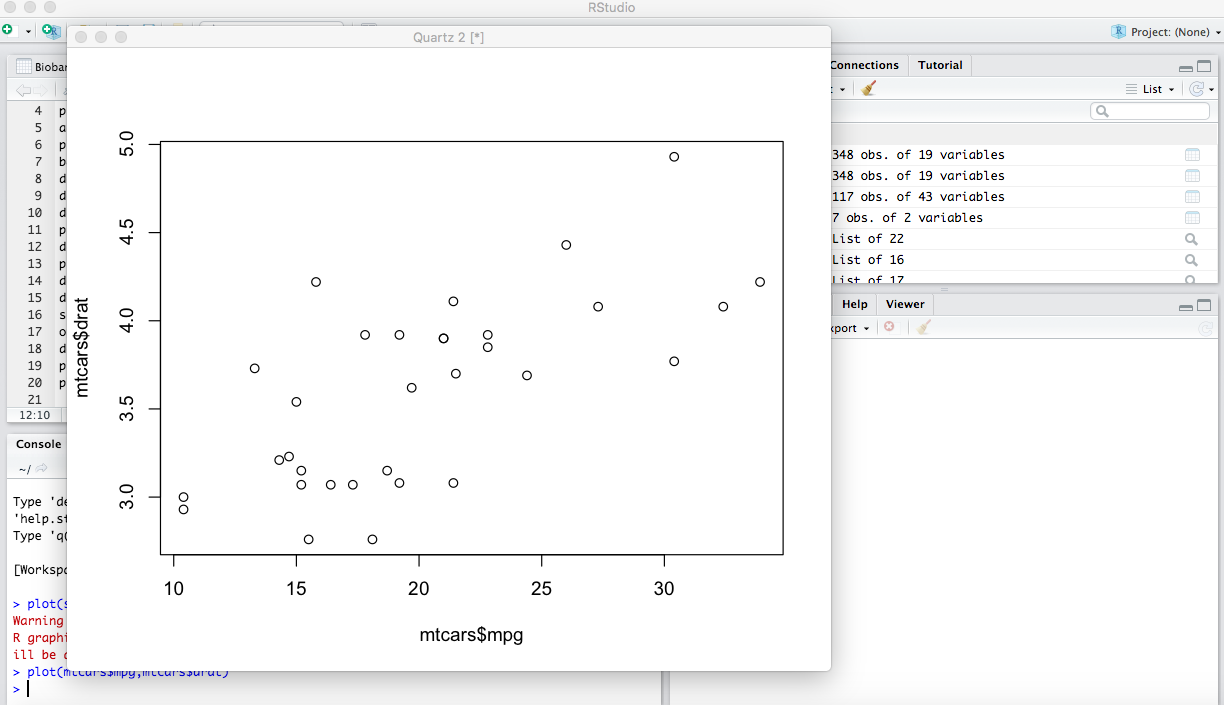
My plots show up in a separate window (quarzt? window) and not in my plots pane.
Tried several things which I found in different blogs but nothing helped:

  • closed / reopened R studio
  • reinstalled R studio
  • checked for newest versions of R and R studio
  • tried dev.off(), dev.new() command
  • tried print(plot()) command
  • tried going to Tools->Global Options->Rmarkdown -> In "Show output preview in" select "Viewer Pane" , then unchecked the box "Show output inline for all R Markdown documents"
  • tried command: options(device = "RStudioGD")
    dev.new()

All of that changed absolutely nothing, still all my plots are showing up in a separate window. Beginning to be quite desperate. Can anybody help please!

Let's try this

plot(mtcars$mpg,mtcars$drat)

Created on 2022-11-26 by the reprex package (v2.0.1)

because it's unclear whether this is in an R script or within a chunk in an Rmarkdown document. If that doesn't work, come back with the output of

sessionInfo()

See the FAQ: How to do a minimal reproducible example reprex for beginners for the best way to illustrate problems that help is being asked on.

Nope, still not working...
still opening in this "quartz" window:

Here the sessionInfo output as requested:

sessionInfo()
R version 4.2.2 (2022-10-31)
Platform: x86_64-apple-darwin17.0 (64-bit)
Running under: macOS High Sierra 10.13.6

Matrix products: default
BLAS: /System/Library/Frameworks/Accelerate.framework/Versions/A/Frameworks/vecLib.framework/Versions/A/libBLAS.dylib
LAPACK: /Library/Frameworks/R.framework/Versions/4.2/Resources/lib/libRlapack.dylib

locale:
[1] en_CA.UTF-8/en_CA.UTF-8/en_CA.UTF-8/C/en_CA.UTF-8/en_CA.UTF-8

attached base packages:
[1] stats graphics grDevices utils datasets methods base

loaded via a namespace (and not attached):
[1] compiler_4.2.2 tools_4.2.2

RStudio only supports macOS versions still being supported by Apple, so you're facing two unpalatable but simple choices— upgrade macOS or root around for an older version of RStudio. What should work, but isn't dead simple, is installing a virtual Ubuntu, R and Rstudio there.

I tried this code
plot(mtcars$mpg,mtcars$drat)

and it shows in the plots pane. Whenever I run my own code using the conjoint function my plots show up in the Quartz window.

This topic was automatically closed 42 days after the last reply. New replies are no longer allowed.

If you have a query related to it or one of the replies, start a new topic and refer back with a link.