Hi all,
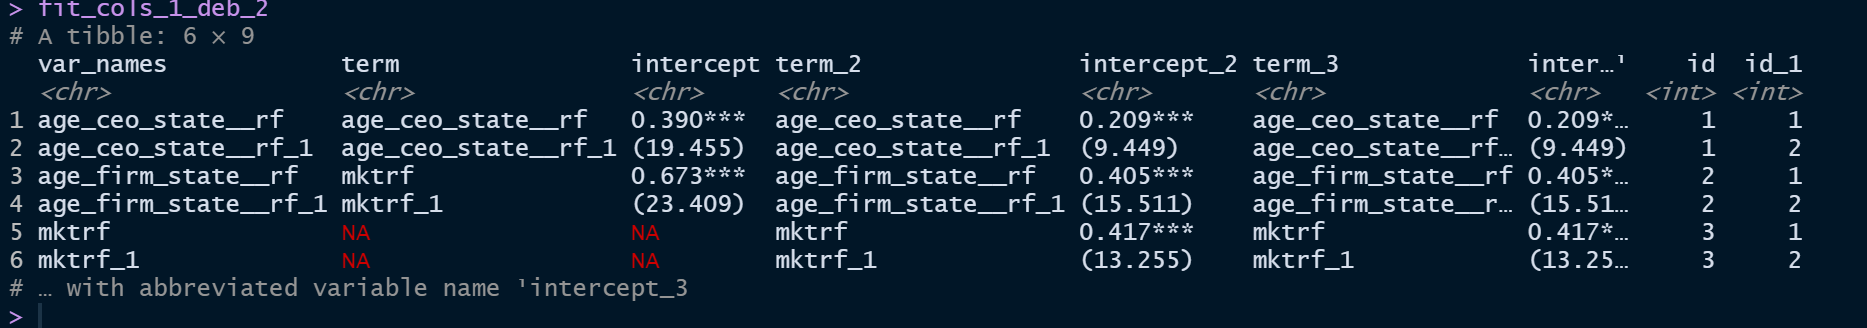
I'm working on creating a table of regression estimates from several models. Here is the data:
structure(list(term = c("age_ceo_state__rf", "", "mktrf", "",
NA, NA), intercept = c("0.390***", "(19.455)", "0.673***", "(23.409)",
NA, NA), term_2 = c("age_ceo_state__rf", "", "age_firm_state__rf",
"", "mktrf", ""), intercept_2 = c("0.209***", "(9.449)", "0.405***",
"(15.511)", "0.417***", "(13.255)"), term_3 = c("age_ceo_state__rf",
"", "age_firm_state__rf", "", "mktrf", ""), intercept_3 = c("0.209***",
"(9.449)", "0.405***", "(15.511)", "0.417***", "(13.255)")), class = c("tbl_df",
"tbl", "data.frame"), row.names = c(NA, -6L))
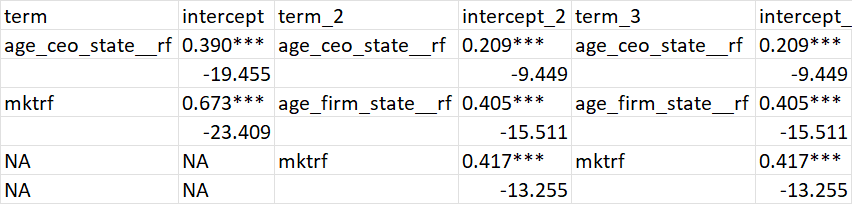
I have been breaking my head for the last week on how to make this presentable as a table of estimates:
This is the original
And this is the goal:
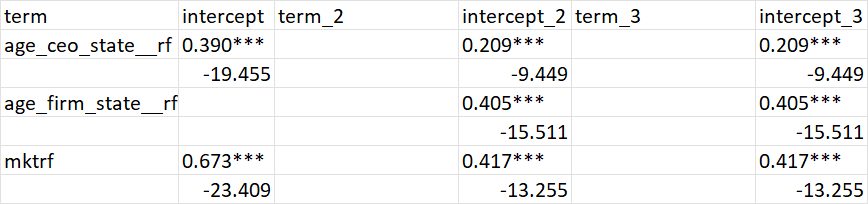
The goal is to make it look like any regression table layout with terms aligned on the same row and the terms not present in a model having a blank space in that column. Should be straightforward but all my attempts to come up with a generalized and easy to debug solution with have failed so far.