hi I have data I want to make into different graphs by groups and add a regression line distinct to each group
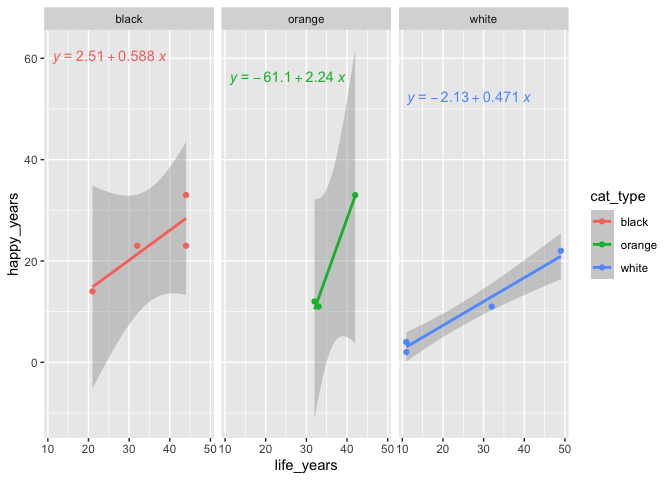
ggplot(data = cats, aes(x = life_years, y =happy_years, group = cat_type, color = cat_type)) +
facet_wrap(~ cat_type) +
geom_point() +
geom_smooth(method = lm)
from this it looks like the same regression line is being apply to each graph? can anyone assist! thank you!!
additionally, is it possible to label the coefficient of each line (like if its .34, or .55) etc thank you