removing 'Strata' and 'All' from at risk tables in survival curves

Here is a sample of my dataframe. Named "sampleforR"

data.frame(
   patientno = c(1,2,3,4,5,6,7,8,9,10,11,12,13,
                 14,15,16,17,18,19,20,21,22,23,24,25,26,27,28,29,
                 30,31,32,33,34,35,NA,NA,NA,NA,NA,NA,NA,NA,NA,NA,
                 NA,NA,NA,NA,NA,NA,NA,NA,NA,NA,NA,NA,NA,NA,NA,
                 NA,NA,NA),
       time = c(315,184,567,444,465,1339,541,259,
                 644,547,773,475,242,699,539,1283,511,552,1066,178,114,
                 316,1116,627,518,380,395,146,410,132,249,30,168,
                 235,263,NA,NA,NA,NA,NA,NA,NA,NA,NA,NA,NA,NA,NA,NA,
                 NA,NA,NA,NA,NA,NA,NA,NA,NA,NA,NA,NA,NA,NA),
      status = c(2,2,1,2,2,2,1,2,2,2,2,2,2,2,1,
                 2,1,2,2,2,2,1,2,2,2,2,2,1,2,2,2,2,1,1,1,2,
                 2,1,2,2,2,2,2,2,2,2,1,1,2,1,2,2,2,2,1,2,2,
                 2,2,2,1,2,1)
)

now, when I enter the following code I get the table below, I cannot remove the text 'STRATA' & 'ALL' on the at risk table. How can I make it go away?? it's spoiling the aesthetics. Thanks
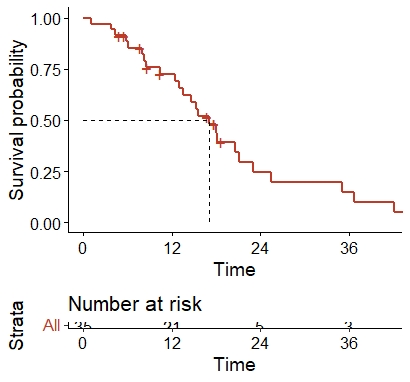
problem

Thanks.

ggsurvplot(survfit(Surv(time,status) ~1, data = sampleforR), palette = "nejm", surv.median.line = "hv", xscale = "d_m", legend = "none", break.x.by = 365.25, conf.int=FALSE, risk.table = T)

Hello,

you can modify the table_theme which should be applied to your table. It is customizable just like normal ggplot2 themes (see the documentation on survminer::theme_survminer() for more informations). Does this look like the result you wish?

sample <- data.frame(
  patientno = c(1,2,3,4,5,6,7,8,9,10,11,12,13,
                14,15,16,17,18,19,20,21,22,23,24,25,26,27,28,29,
                30,31,32,33,34,35,NA,NA,NA,NA,NA,NA,NA,NA,NA,NA,
                NA,NA,NA,NA,NA,NA,NA,NA,NA,NA,NA,NA,NA,NA,NA,
                NA,NA,NA),
  time = c(315,184,567,444,465,1339,541,259,
           644,547,773,475,242,699,539,1283,511,552,1066,178,114,
           316,1116,627,518,380,395,146,410,132,249,30,168,
           235,263,NA,NA,NA,NA,NA,NA,NA,NA,NA,NA,NA,NA,NA,NA,
           NA,NA,NA,NA,NA,NA,NA,NA,NA,NA,NA,NA,NA,NA),
  status = c(2,2,1,2,2,2,1,2,2,2,2,2,2,2,1,
             2,1,2,2,2,2,1,2,2,2,2,2,1,2,2,2,2,1,1,1,2,
             2,1,2,2,2,2,2,2,2,2,1,1,2,1,2,2,2,2,1,2,2,
             2,2,2,1,2,1)
)
library(survminer)
#> Loading required package: ggplot2
#> Loading required package: ggpubr
library(survival)
#> 
#> Attaching package: 'survival'
#> The following object is masked from 'package:survminer':
#> 
#>     myeloma

# create the survival fit
fit<- survfit(Surv(time, status) ~ 1, data = sample)
# customize the table theme
custom_theme <- theme_survminer() +
  theme(axis.title.x = element_blank(),
        axis.title.y = element_blank())
# apply custom table theme
ggsurvplot(fit, data = sample,
           palette = "nejm",
           surv.median.line = "hv",
           xscale = "d_m",
           legend = "none",
           break.x.by = 365.25,
           conf.int=FALSE,
           risk.table = T,
           tables.theme = custom_theme)

Created on 2022-09-24 with reprex v2.0.2

Kind regards

This topic was automatically closed 7 days after the last reply. New replies are no longer allowed.

If you have a query related to it or one of the replies, start a new topic and refer back with a link.