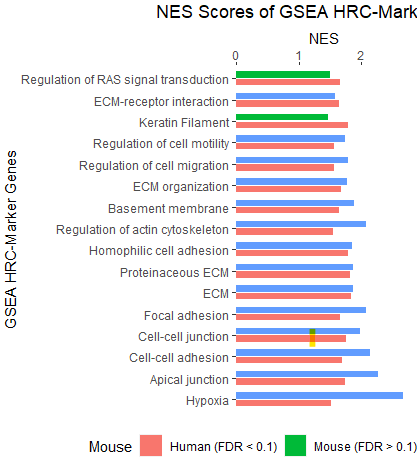
Hello, I am trying to reorder all my bars in ascending order for all my factors within my bar plot and have tried the reorder() function and it is not coming up with any solutions.
Any help with this will be greatly appreciated. This is my code as it currently stands:
#install.packages("readxl")
#install.packages("tidyverse")
#install.packages("ggplot2")


library(readxl)
library(tidyverse)
library(ggplot2)

url <-'https://static-content.springer.com/esm/art%3A10.1038%2Fs41586-022-05402-9/MediaObjects/41586_2022_5402_MOESM11_ESM.xlsx'
#Create a dataframe from the Excel data
temp <-tempfile()
download.file(url, temp, mode='wb')
myData <- read_excel(path = temp, sheet = "Figure 1i")


myData %>%
#Select the columns and rows that are needed, columns: 2, 4 and 6 and rows 1 to 32.
select(c(2,4,6)) %>%
slice(1:32) %>%

#Rename columns
rename(GSEA_HRC_Marker_Genes = NAME,
       Mouse= sign) %>%

#Change column 3 to display as.factor
mutate(across(c(3), as.factor)) %>%


ggplot(aes(x=NES, y=GSEA_HRC_Marker_Genes, fill = Mouse)) +

geom_bar(stat='identity', width = 0.6, position = position_dodge(width = 0.7)) +

ggtitle("NES Scores of GSEA HRC-Marker Genes") +


xlab("NES")+
ylab("GSEA HRC-Marker Genes") +

scale_y_discrete(labels = c("HALLMARK_HYPOXIA" = "Hypoxia",
                            "HALLMARK_APICAL_JUNCTION" = "Apical junction",
                            "GO0016337 CELL-CELL ADHESION" = "Cell-cell adhesion",
                            "GO0005911 CELL-CELL JUNCTION" = "Cell-cell junction",
                            "04510 FOCAL ADHESION" = "Focal adhesion",
                            "GO0031012 EXTRACELLULAR MATRIX" = "ECM",
                            "GO0005578 PROTEINACEOUS EXTRACELLULAR MATRIX" = "Proteinaceous ECM",
                            "GO0007156 HOMOPHILIC CELL ADHESION" = "Homophilic cell adhesion",
                            "04810 REGULATION OF ACTIN CYTOSKELETON" = "Regulation of actin cytoskeleton",
                            "GO0005604 BASEMENT MEMBRANE" = "Basement membrane",
                            "GO0030198 EXTRACELLULAR MATRIX ORGANIZATION" = "ECM organization",
                            "GO0030334 REGULATION OF CELL MIGRATION" = "Regulation of cell migration",
                            "GO2000145 REGULATION OF CELL MOTILITY" = "Regulation of cell motility",
                            "GO0045095 KERATIN FILAMENT" = "Keratin Filament",
                            "04512 ECM-RECEPTOR INTERACTION" = "ECM-receptor interaction",
                            "GO0046578 REGULATION OF RAS PROTEIN SIGNAL TRANSDUCTION" = "Regulation of RAS signal transduction")) +

scale_x_continuous(position = "top", expand = expansion(mult = c(0, 0.05))) +


scale_fill_discrete(labels=c('Human (FDR < 0.1)', 'Mouse (FDR > 0.1)','Mouse (FDR > 0.1)')) +

theme(legend.direction = "horizontal", legend.position = "bottom") +
theme(plot.title = element_text(hjust = 0.5)) +
theme(panel.background = element_blank())