Hi,
I have a plot
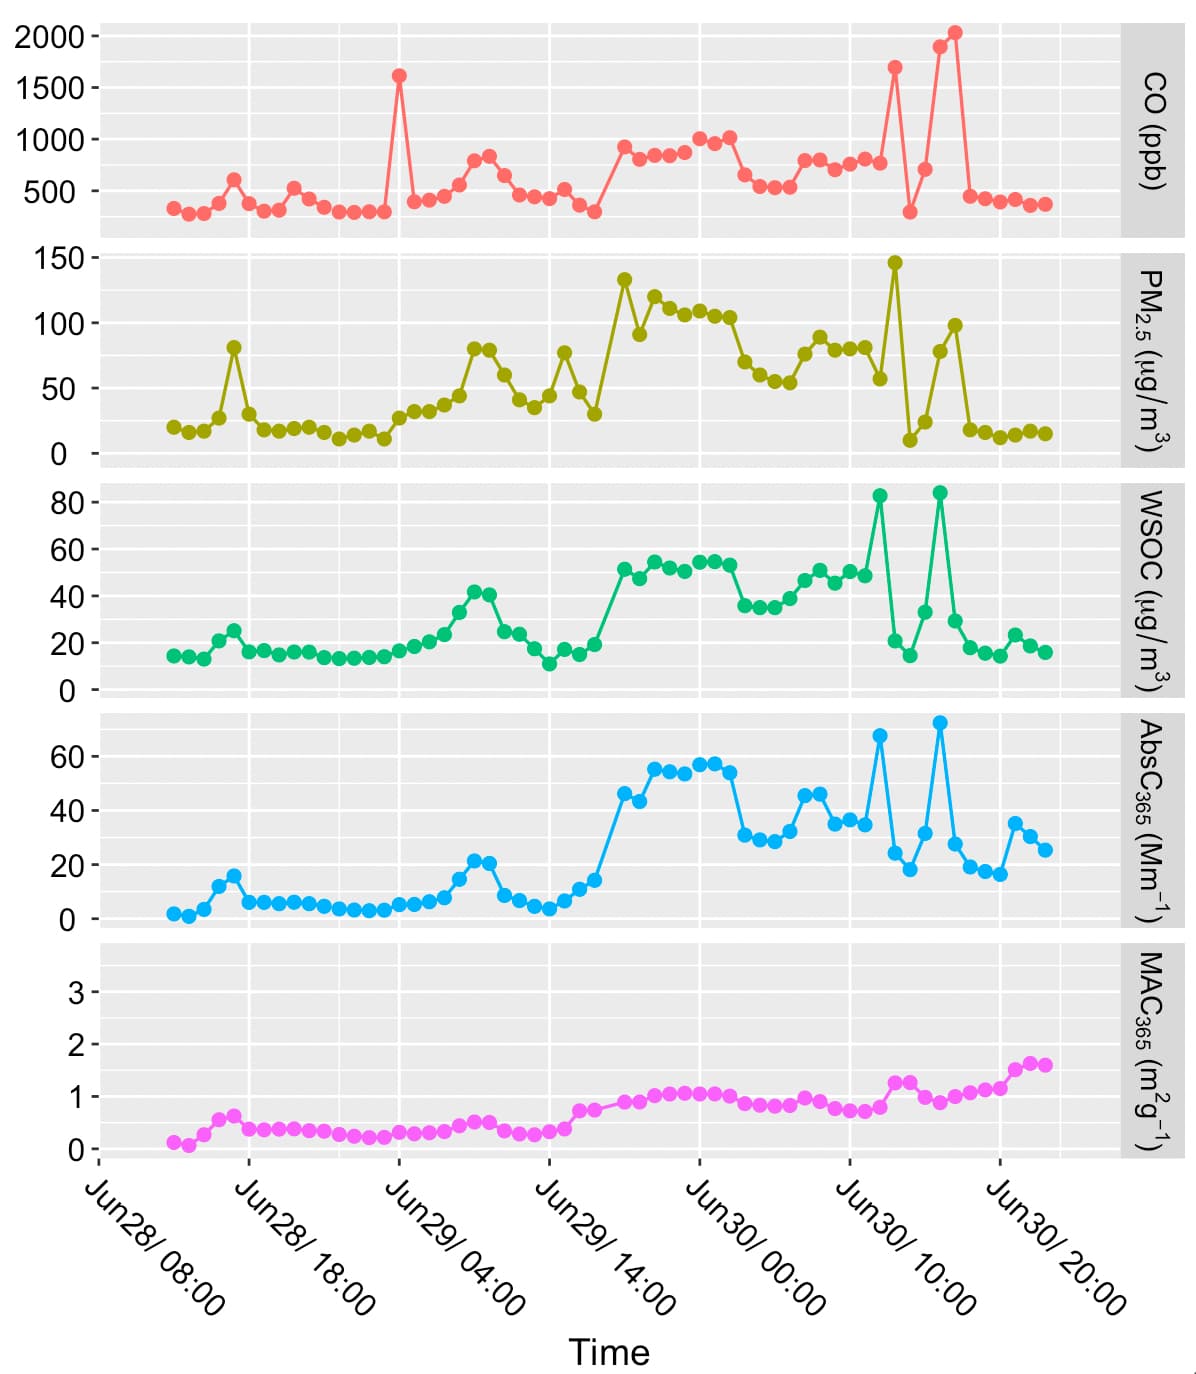
In this plot, I want to reset the range of MAC from 0 to 2, the bottom first plot (MAC).
for this plot, the code is
hourlya_PILS_02a %>%
  ggplot(aes(x = hour, y = value, colour = variable,group = format(hour, "%m-%d"))) +
  geom_point(size=2) + geom_line(size=0.6) +
  xlab("Time") +
  ylab("") +
  labs(title = "")+
  #theme_test() +
  theme(legend.title=element_blank()) +
  theme(legend.text=element_text(size=rel(0.8)))+
  theme(legend.position="none")+
  theme(axis.title = element_text(face="plain",size=14,color="black"),
        axis.text=element_text(size=12,face="plain", color="black"),
        axis.title.x = element_text(vjust=0.1),
        axis.text.y=element_text(hjust=0.5),
        axis.text.x=element_text(hjust=0.0, angle = -45),
        plot.title = element_text(size=12)) +
  theme(strip.text = element_text(size=10, color="black"))+
  facet_grid(variable ~., switch = "x", scales = "free_y", space = "free_x",
             labeller = label_parsed)  +
  scale_x_datetime(expand=c(0,0),
                   date_breaks= "10 hour",
                   date_minor_breaks = "10 hour",
                   date_labels = "%h%d/ %H:%M",
                   limits = as.POSIXct(c("2019-06-28 00:00:00", "2019-06-30 18:00:00")))
Please provide some information on how to do that.
Thanks