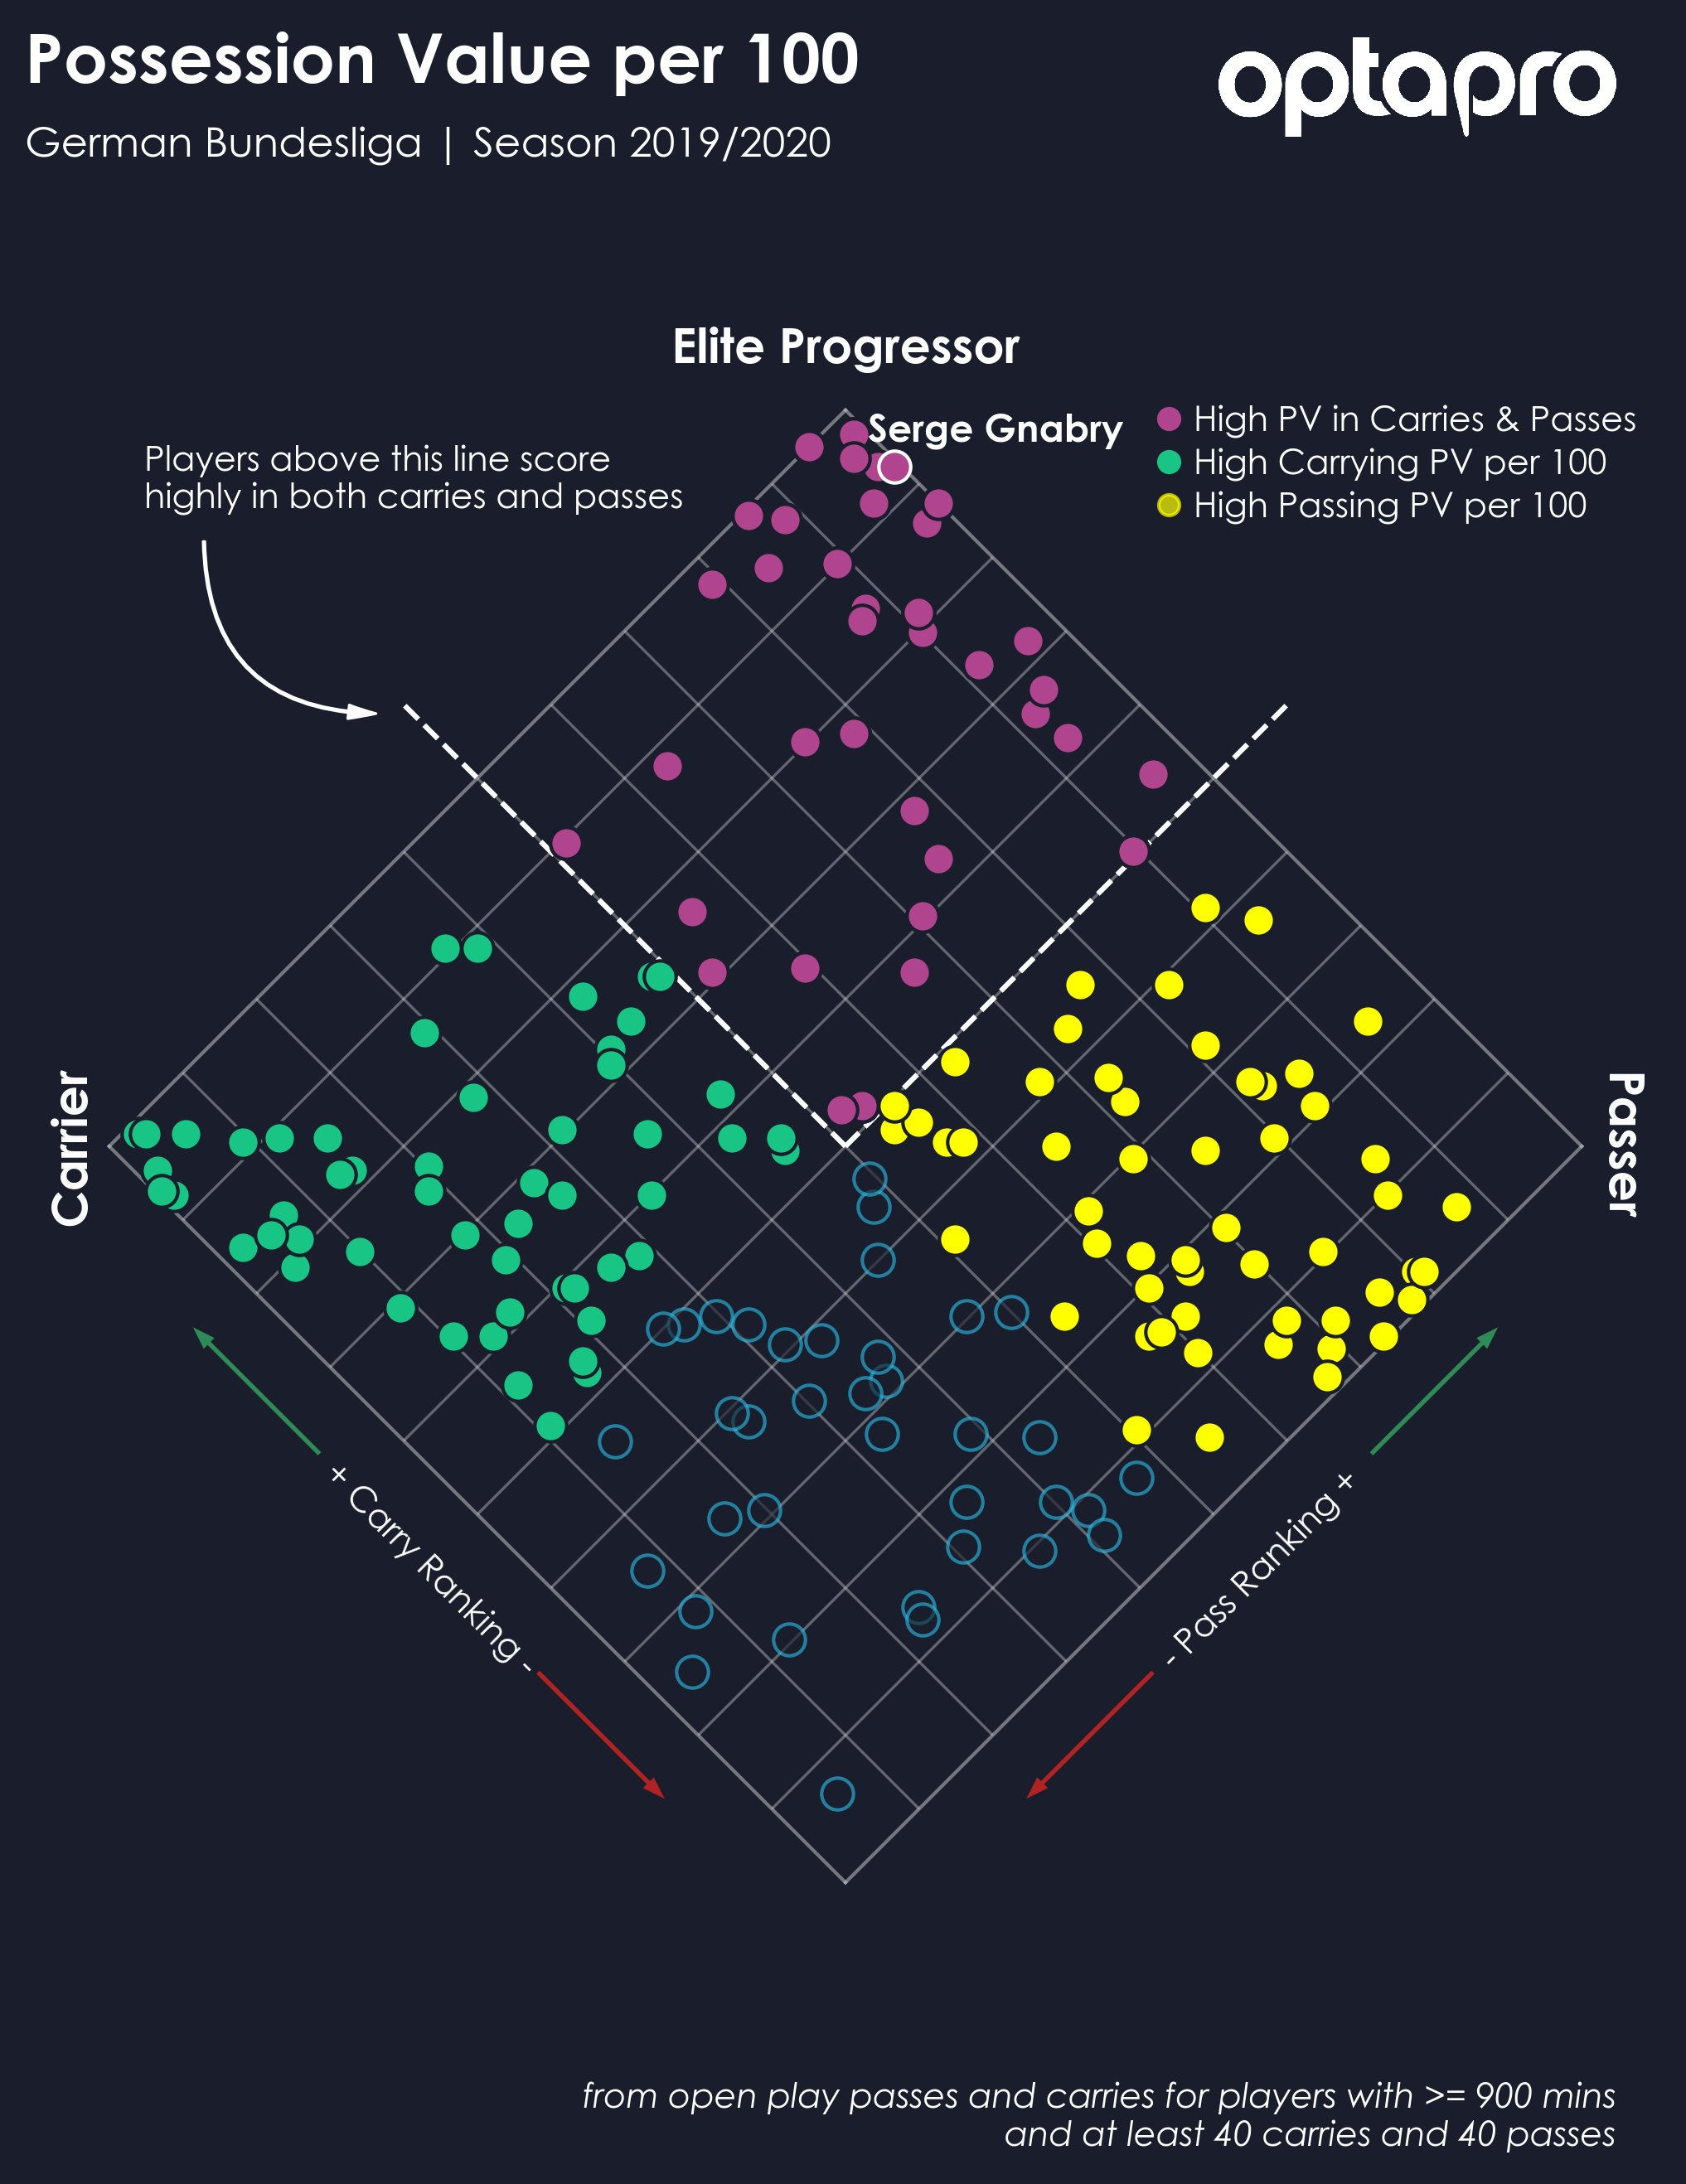
I am interested in creating a scatter plot in which the plot area is rotated at 45 degrees such that the line y=x is oriented vertically up the middle. A similar effect is shown in this visualisation by Peter McKeever:
I believe that orienting the y=x line to be vertical (or horizontal) can be beneficial in cases where you want to focus on the deviation from that line, or where there is a natural spatial element to the chart.
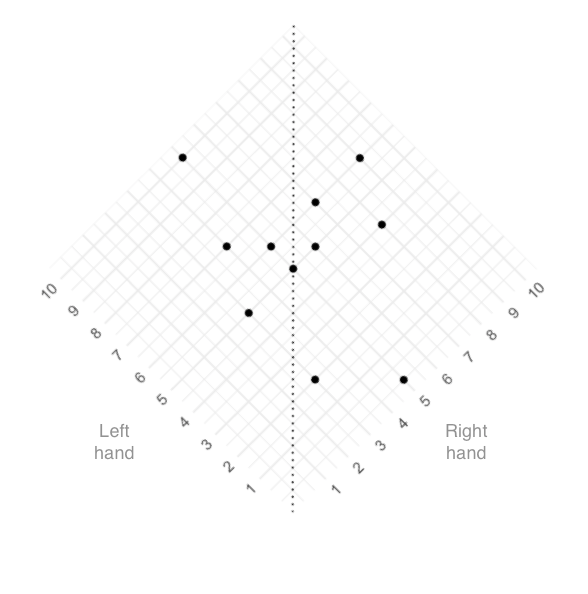
For example, let's say we conducted an experiment where we counded the number of actions performed with the left and right hands. If we were plotting these on a scatter plot (x = count with right hand, y = count with left hand), then it would be nice if the orientation of the axes also corresponded to the right and left hand side like so:
Is there a way to acheive this with ggplot2? I have not seen any obvious options in theme that would enable this, but perhaps someone has managed something with a package like patchwork or cowplot?
It seems this may be one valid area where matplotlib comes out ahead of ggplot2, but I would love to find out that that's not the case!
Hi Nir, thanks for your suggestion. I've tried reticulate before and it's worked fine, but for the time being I'm interested in seeing if there's a ggplot solution that will work well with the rest of our setup at work.
That's very nice, Jan. Thank you - I played with this approach, but getting the title to work well has proven difficult - as has composing ggplots with something like patchwork.
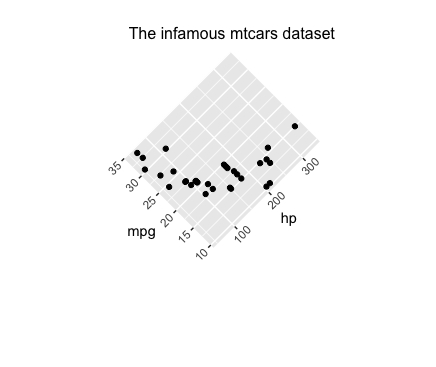
That said, this is the closest I have come so far. Thanks again!