Same line through different shapes in ggplot2

Hi, can you have the same line pass through different shapes in a ggplot?

For example:

library(tidyverse)
library(lubridate)

df <- tibble::tribble(
  ~SAMPLE_DATE, ~REPORT_RESULT_VALUE, ~DETECT_FLAG,
  "2010-01-29",                  0.5,          "N",
  "2018-10-05",                 0.28,          "Y",
  "2019-05-03",                 0.65,          "Y",
  "2019-10-05",                 0.15,          "N",
  "2020-06-02",                 0.23,          "Y",
  "2020-09-12",                 0.15,          "N",
  "2021-04-24",                 0.15,          "N",
  "2021-08-25",                 0.15,          "N",
  "2022-05-04",                  0.4,          "Y"
) %>% 
  mutate(SAMPLE_DATE = ymd(SAMPLE_DATE))


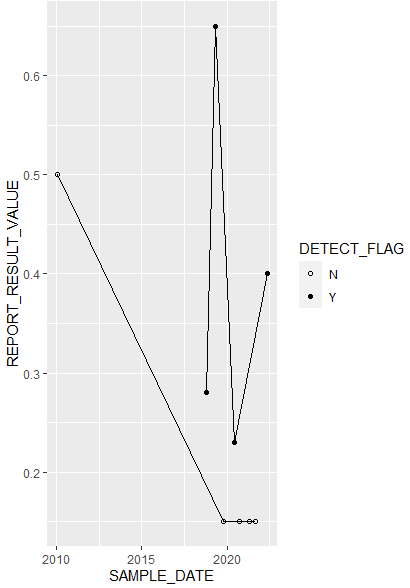
ggplot(df, aes(SAMPLE_DATE, REPORT_RESULT_VALUE, shape = DETECT_FLAG)) +
  geom_line() +
  geom_point() +
  scale_shape_manual(values = c("N" = 1, "Y" = 19)) 

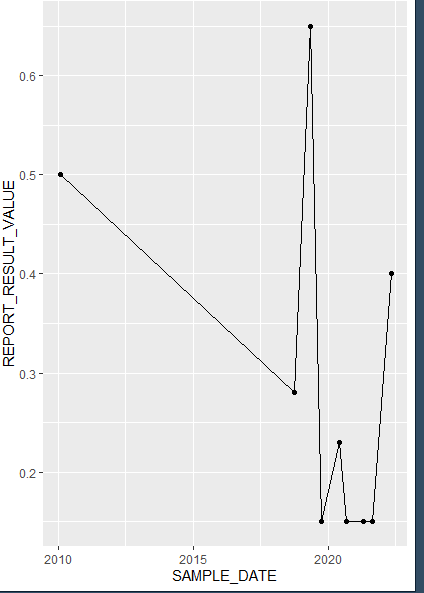
Ideally this would just be one line:

Like this, but with the shapes:

Don't worry about it. I've worked it out.

ggplot(df, aes(SAMPLE_DATE, REPORT_RESULT_VALUE)) +
  geom_line() +
  geom_point(aes(shape = DETECT_FLAG)) +
  scale_shape_manual(values = c("N" = 1, "Y" = 19)) 
1 Like

This topic was automatically closed 7 days after the last reply. New replies are no longer allowed.

If you have a query related to it or one of the replies, start a new topic and refer back with a link.