Hi altruists,
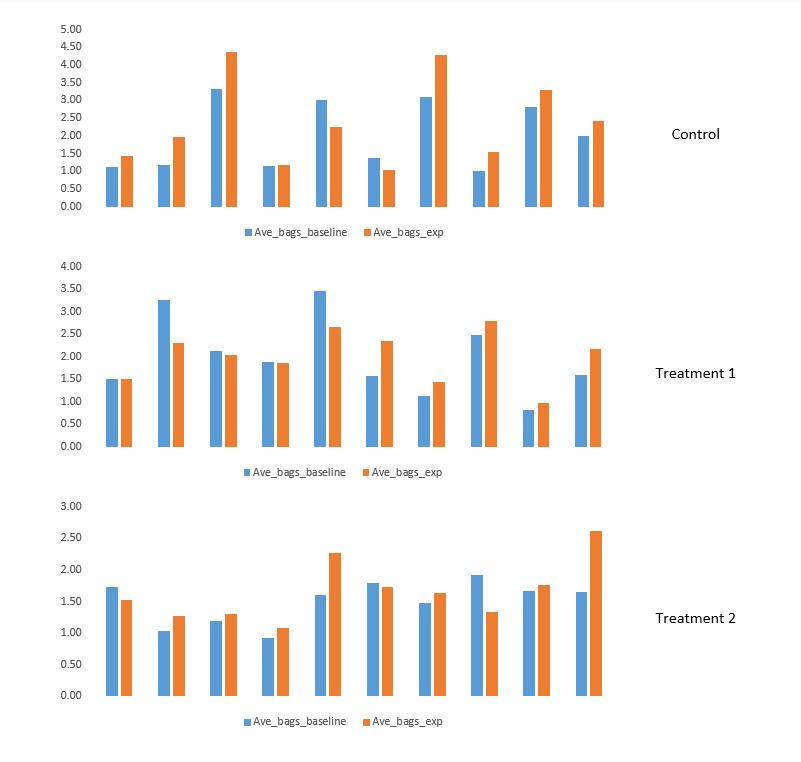
I am looking for help creating a graph using ggplot2. I can create this graph part-by-part in excel, but I am lost in R. I am attaching an image for your convenience.
1 Like
Hi @TahsinHasan , try to put a reproducible example of data for better help you.
This plot is a little easy with some libraries.
Can you run this code and paste the output here? dput(head(yourdataframe,10))
This topic was automatically closed 21 days after the last reply. New replies are no longer allowed.
If you have a query related to it or one of the replies, start a new topic and refer back with a link.