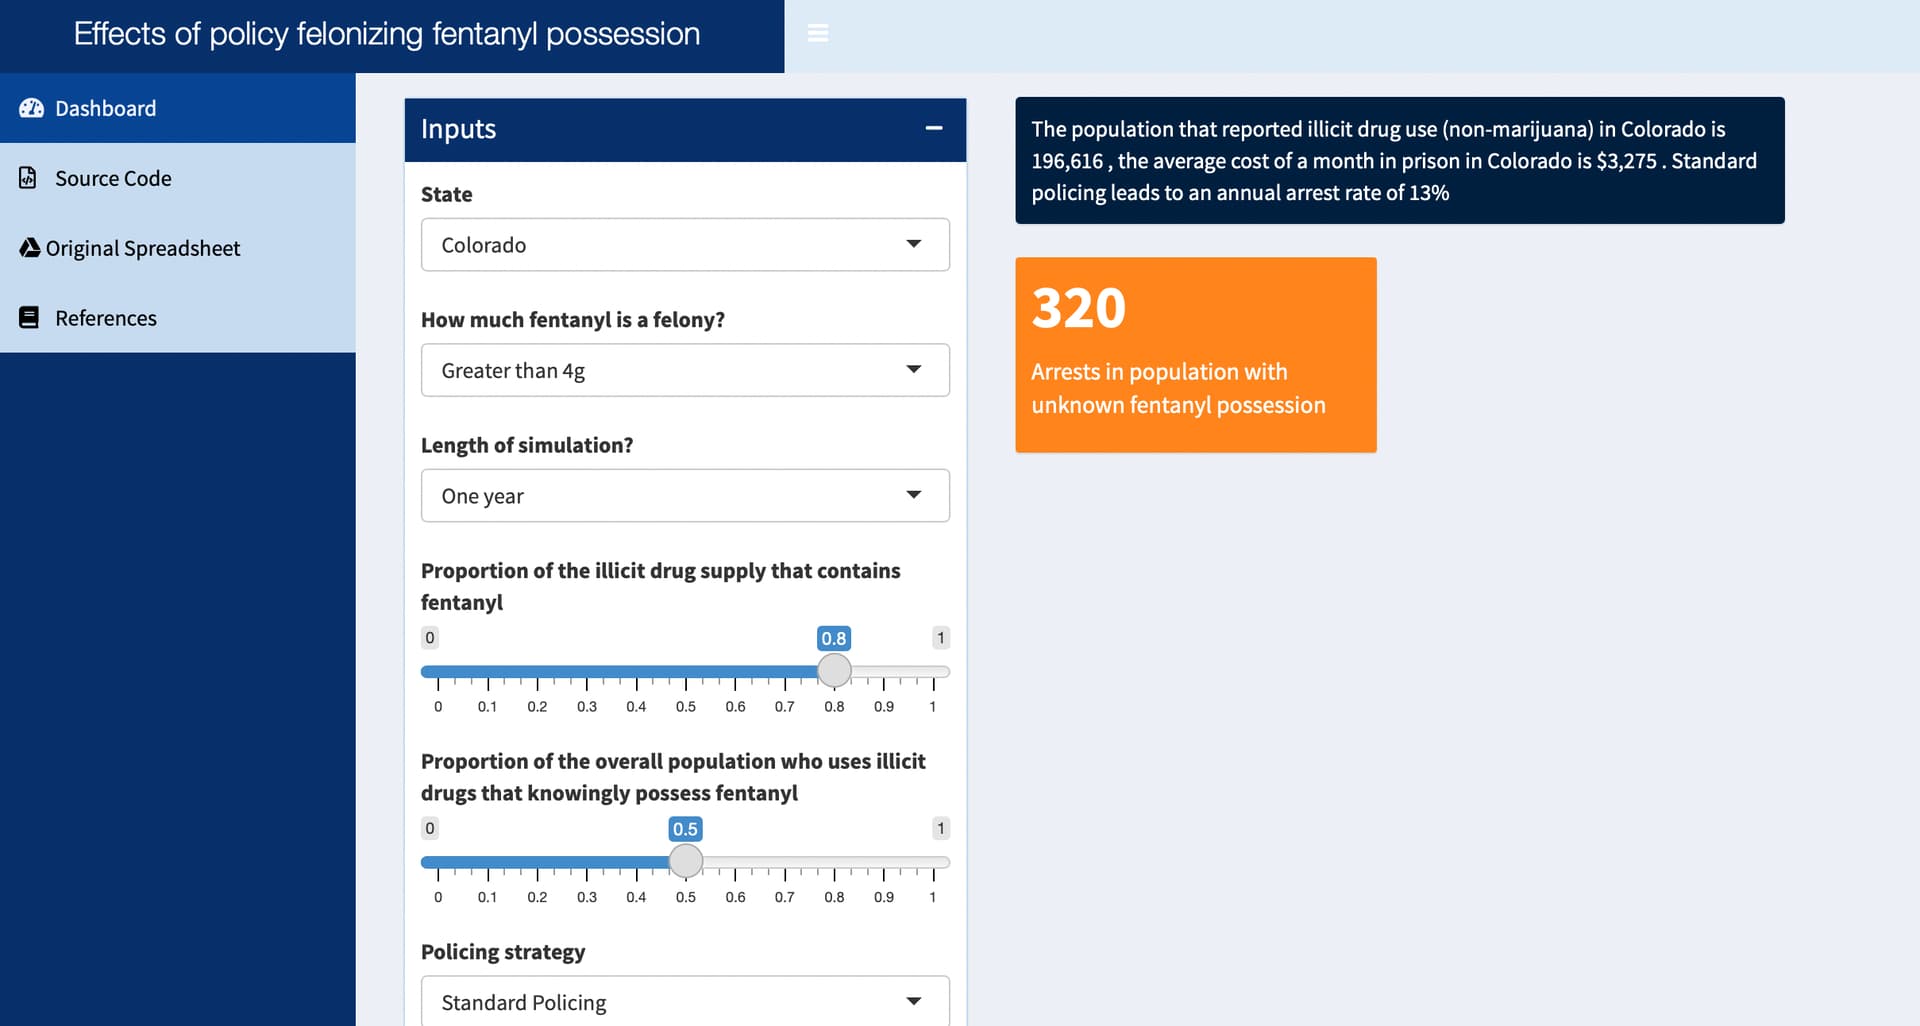
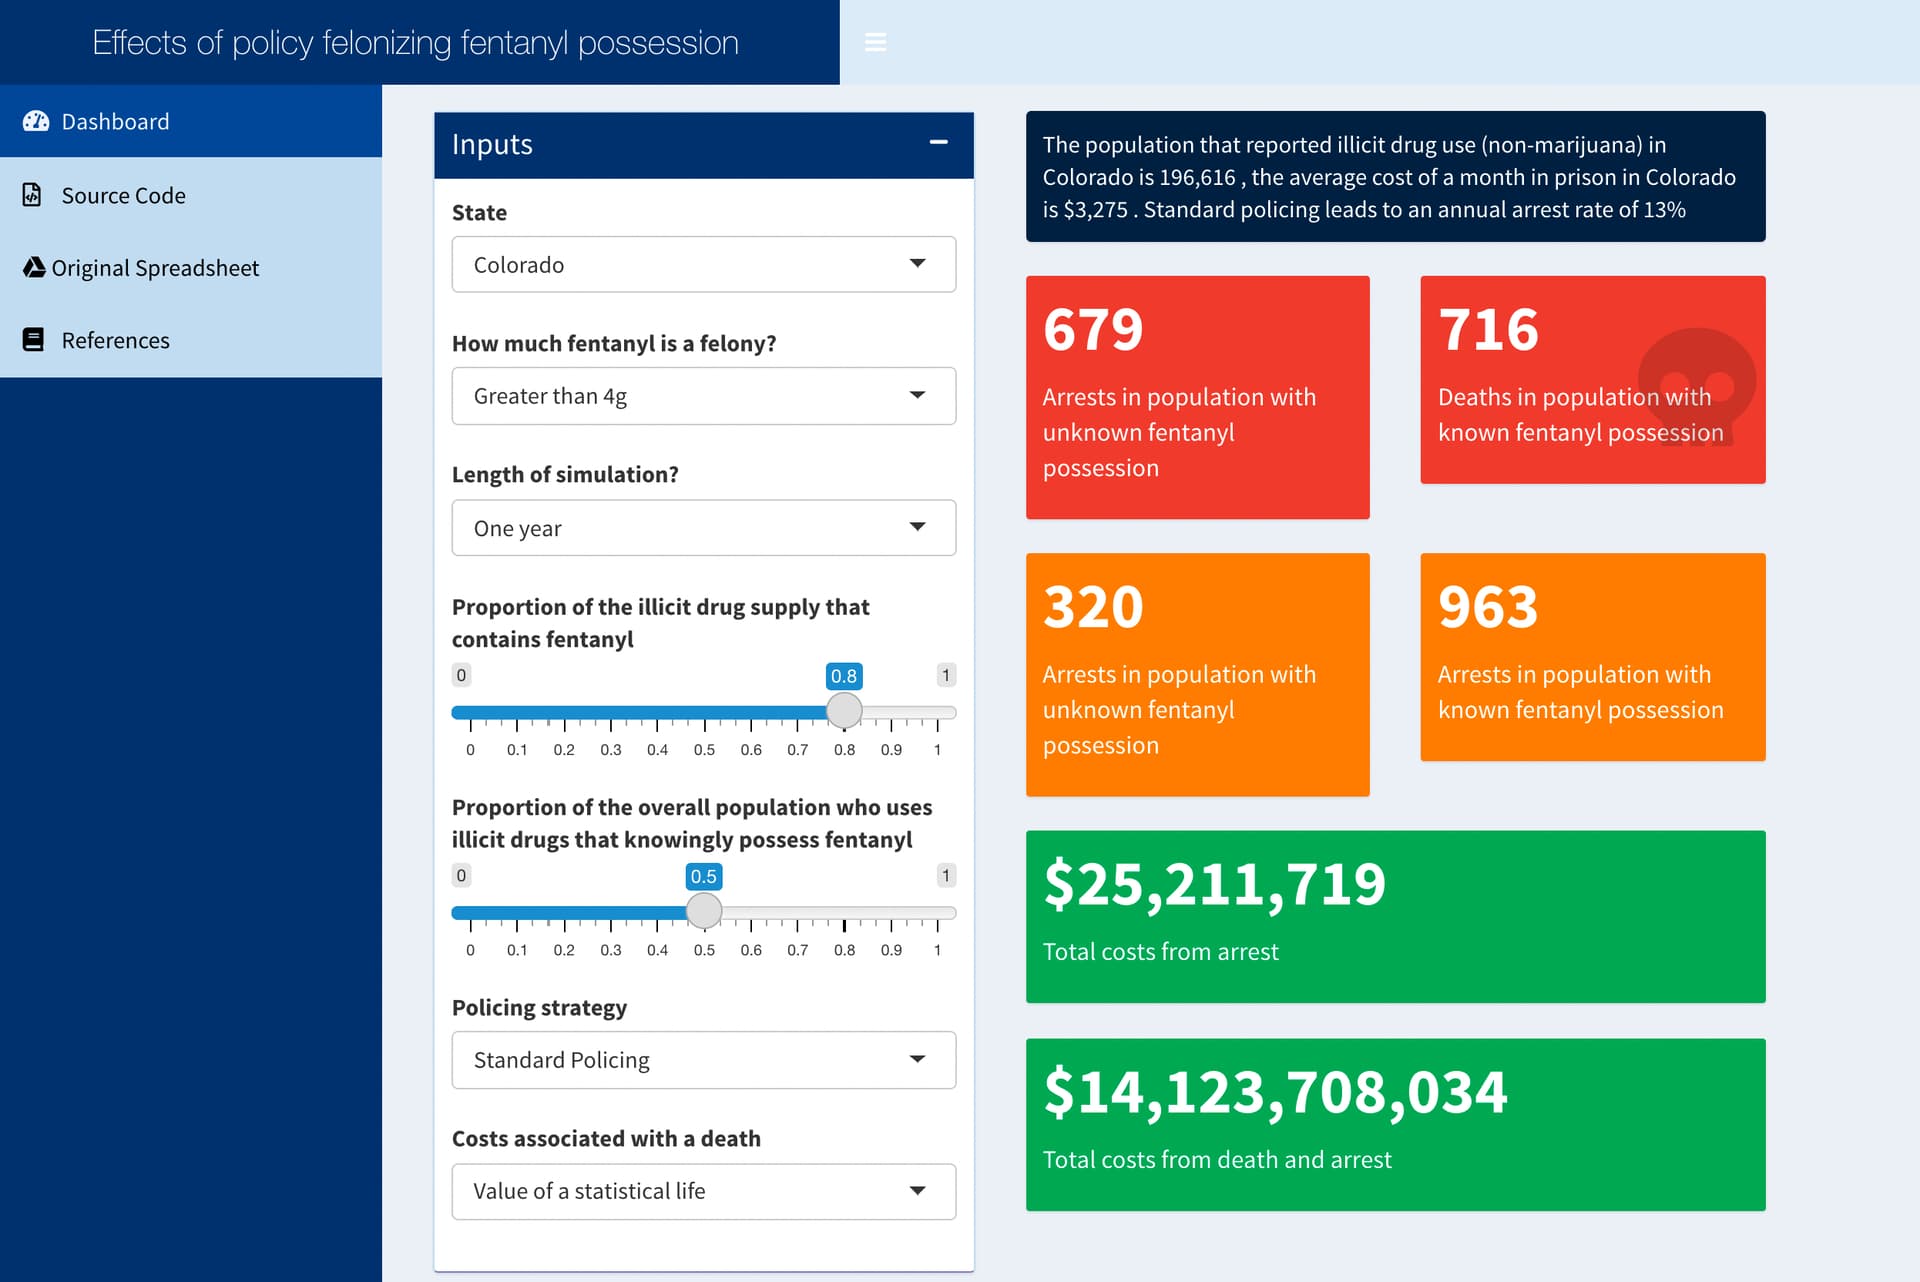
My app is deploying perfectly locally, but some of the outputs are missing when I deploy on shinyapps.io... no errors...
Code below:
Server:
library(shiny)
library(shinydashboard)input_element_color <- "primary"
highlight_color <- "navy"
regular_color <- "navy"shinyServer(function(input, output) {
output$I_plot <- renderPlot({
############# Multiple plot function ###################
## http://www.cookbook-r.com/Graphs/Multiple_graphs_on_one_page_(ggplot2)/ ##

# multiplot <- function(..., plotlist=NULL, file, cols=1, layout=NULL) {
#     library(grid)
#
#     # Make a list from the ... arguments and plotlist
#     plots <- c(list(...), plotlist)
#
#     numPlots = length(plots)
#
#     # If layout is NULL, then use 'cols' to determine layout
#     if (is.null(layout)) {
#         # Make the panel
#         # ncol: Number of columns of plots
#         # nrow: Number of rows needed, calculated from # of cols
#         layout <- matrix(seq(1, cols * ceiling(numPlots/cols)),
#                          ncol = cols, nrow = ceiling(numPlots/cols))
#     }
#
#     if (numPlots==1) {
#         print(plots[[1]])
#
#     } else {
#         # Set up the page
#         grid.newpage()
#         pushViewport(viewport(layout = grid.layout(nrow(layout), ncol(layout))))
#
#         # Make each plot, in the correct location
#         for (i in 1:numPlots) {
#             # Get the i,j matrix positions of the regions that contain this subplot
#             matchidx <- as.data.frame(which(layout == i, arr.ind = TRUE))
#
#             print(plots[[i]], vp = viewport(layout.pos.row = matchidx$row,
#                                             layout.pos.col = matchidx$col))
#         }
#     }
# }


# Fentanyl policy project

# install.packages("markovchain")
#  install.packages("diagram")
library(markovchain)
library(diagram)
library(ggplot2)
library(tidyverse)
library(kableExtra)
library(priceR)

# Alexandra Savinkina
# 6/7/22

#Inputs:

atRisk <- input$atRisk

Prop_Incid <- 1-input$PropIncid
Prop_Reg <- input$PropIncid

PropHighIncid <- 0.1
PropMedIncid <- 0.3
PropLowIncid <- 0.6

PropHighReg <- 0.3
PropMedReg <- 0.5
PropLowReg <- 0.2

PropFentanyl <- input$propFentanyl


Prop_AtRisk_Incid <- ifelse(atRisk==1, Prop_Incid*PropHighIncid,
                            ifelse(atRisk==2, Prop_Incid*(PropHighIncid+PropMedIncid),
                                   ifelse(atRisk==3, Prop_Incid,0)))
Prop_AtRisk_Reg <- ifelse(atRisk==1, Prop_Reg*PropHighReg,
                          ifelse(atRisk==2, Prop_Reg*(PropHighReg+PropMedReg),
                                 ifelse(atRisk==3, Prop_Reg,0)))


Death_Rate_Incid <- 0.000703391#0.0029/12 #assuming 15% fatal overdose # 0.0019 assuming 10% fatal overdose
Death_Rate_Reg <- 0.000703391#0.0029/12 #assuming 15% fatal overdose # 0.0019 assuming 10% fatal overdose

Death_Rate_Jail <- 0.00001/12

Arrest_Rate_Incid <- as.numeric(input$Arrests)/12
Arrest_Rate_Reg <- Arrest_Rate_Incid

Arrest_text1 <- ifelse(input$Arrests==0.13, "Standard policing",
                       ifelse(input$Arrests==0.05, "Treatment-informed Policing", "Aggressive Policing"))

Arrest_text2 <- ifelse(input$Arrests==0.13, "13%",
                       ifelse(input$Arrests==0.05, "5%", "20%"))

Charge_Rate_Incid <- 1
Charge_Rate_Reg <- 1

Jail_Rate_Incid <- Arrest_Rate_Incid*Charge_Rate_Incid
Jail_Rate_Reg <- Arrest_Rate_Reg*Charge_Rate_Reg

Arrest_Mult_Arrest <- 2.43
Arrest_Mult_Death1 <- 40
Arrest_Mult_Death2 <- 10


state_cost <- read.csv(file='prisoncosts_state.csv')
state_cost <- state_cost[,c(1,5)]

Cost_Jail <- as.numeric(state_cost[which(state_cost$State==input$costarrest),2])

Cost_Death <- ifelse(input$costdeath == "Value of a statistical life",  10099517 ,
                     ifelse(input$costdeath == "Healthcare costs only",  5462,
                            ifelse(input$costdeath == "Lost productivity costs only",  1443151,0 )))

drug_use_pop_state <- read.csv(file="drugusestate.csv")

N_pop1 <- (as.numeric(drug_use_pop_state[which(drug_use_pop_state$State==input$costarrest),4]))
N_pop <- (as.numeric(drug_use_pop_state[which(drug_use_pop_state$State==input$costarrest),4]))*PropFentanyl

# Model parameters

# Rate of first felony:

Felony_1_incid <-Jail_Rate_Incid*Prop_AtRisk_Incid
Felony_1_reg <-Jail_Rate_Reg*Prop_AtRisk_Reg

# Rate of second felony

Felony_2_incid <-Jail_Rate_Incid*Prop_AtRisk_Incid*Arrest_Mult_Arrest
Felony_2_reg <-Jail_Rate_Reg*Prop_AtRisk_Reg*Arrest_Mult_Arrest

# Rate of death, not directly after incarceration

Death_1_incid <- Death_Rate_Incid
Death_1_reg <- Death_Rate_Reg

# Rate of death directly following incarceration

Death_2_incid <- Death_Rate_Incid*Arrest_Mult_Death1
Death_2_reg <- Death_Rate_Reg*Arrest_Mult_Death1

Death_3_incid <- Death_Rate_Incid*Arrest_Mult_Death2
Death_3_reg <- Death_Rate_Reg*Arrest_Mult_Death2

# Model

trans_mat <- matrix(c(1-Felony_1_incid-Death_1_incid,Felony_1_incid,0,0,0,Death_1_incid,0,0,0,0,0,0,# Not Jailed, incidental
                      0,(1-Death_Rate_Jail-1/6),1/6,0,0,Death_Rate_Jail,0,0,0,0,0,0, # Jail, first time, incidental
                      0, Felony_2_incid, 0, 1-Death_3_incid-Felony_2_incid,0, Death_3_incid,0,0,0,0,0,0,# Within one month of release
                      0, Felony_2_incid, 0, 1-Felony_2_incid-Death_2_incid-1/11, 1/11, Death_2_incid,0,0,0,0,0,0,# First year within release
                      0, Felony_2_incid, 0, 0, 1-Felony_2_incid-Death_1_incid, Death_1_incid,0,0,0,0,0,0,# More than 1 post-release incidental
                      0,0,0,0,0,1,0,0,0,0,0,0, # Death, incid
                      0,0,0,0,0,0,1-Felony_1_reg-Death_1_reg,Felony_1_reg,0,0,0,Death_1_reg,# Not Jailed, not regental
                      0,0,0,0,0,0,0,(1-Death_Rate_Jail-1/6),1/6,0,0,Death_Rate_Jail, # Jail, first time, not regental
                      0,0,0,0,0,0,0, Felony_2_reg, 0, 1-Death_3_reg-Felony_2_reg,0, Death_3_reg,# Directly post-release not regental
                      0,0,0,0,0,0,0,Felony_2_reg, 0, 1-Felony_2_reg-Death_2_reg-1/11, 1/11, Death_2_reg,# More than 6 months post-release not regental
                      0,0,0,0,0,0,0, Felony_2_reg, 0, 0, 1-Felony_2_reg-Death_1_reg, Death_1_reg,
                      0,0,0,0,0,0,0,0,0,0,0,1 # Death, not incidental
),nrow = 12, byrow = TRUE)
trans_mat


disc_trans <- new("markovchain",transitionMatrix=trans_mat, states=c("Not arrested, incidental use","Arrested, incidental use","Released, Immediate, incidental use","Released, within year, incidental use","Released, post one year, incidental use","Dead, incidental use",
                                                                     "Not arrested, regular use","Arrested, regular use","Released, Immediate, regular use","Released, within year, regular use","Released, post one year, regular use","Dead, regular use"), name="MC 1")

disc_trans
#plot(disc_trans)

Current_state<-c(Prop_Incid,0,0,0,0,0,Prop_Reg,0,0,0,0,0)
steps<-as.numeric(input$timeframe)*12

Data <- data.frame(matrix(0,nrow=steps,ncol=13))
colnames(Data) <- c("month","Not arrested_incid","Arrested_incid","Released_immediate_incid","Released_1yr_incid","Released_post1yr_incid","Dead_incid",
                    "Not arrested_reg","Arrested_reg","Released_immediate_reg","Released_1yr_reg","Released_post1yr_reg","Dead_reg")
Data$month <- c(1:steps)

for (i in 1:steps) {

  finalState<-Current_state*disc_trans^i #using power operator
  Data[i,2:13] <- finalState

}


Data_People <- Data*N_pop
Data_People$month <- trunc(Data_People$month/N_pop)

Data_People$ChargeCost <- Data_People$Arrested_incid*Cost_Jail+Data_People$Arrested_reg*Cost_Jail
Data_People$DeathCost <- Data_People$Dead_incid*Cost_Death+Data_People$Dead_reg*Cost_Death

Data_People$ChargeCostCum <- cumsum(Data_People$ChargeCost)

Data_People2 <- Data_People[,c(1,3:16)]
Data_Long <- gather(Data_People2, key="observation", value="value",-month)
Data_Long2 <- gather(Data_People, key="observation", value="value",-month)


Data_Cost_Long <- Data_Long2[which((Data_Long2$observation=="ChargeCostCum"|Data_Long2$observation=="DeathCost") & Data_Long2$month==steps),]

#
#output$Table <- renderTable(Data_People)

time= as.numeric(input$timeframe)*12

Deaths_incid <- trunc(Data_People[Data_People$month==time,'Dead_incid'])
Arrests_incid <- trunc(Data_People[Data_People$month==time,'Arrested_incid']) +
  trunc(Data_People[Data_People$month==time,'Released_immediate_incid'])+
  trunc(Data_People[Data_People$month==time,'Released_post1yr_incid'])

Deaths_reg <- trunc(Data_People[Data_People$month==time,'Dead_reg'])
Arrests_reg <- trunc(Data_People[Data_People$month==time,'Arrested_reg']) +
  trunc(Data_People[Data_People$month==time,'Released_immediate_reg'])+
  trunc(Data_People[Data_People$month==time,'Released_post1yr_reg'])

Costs_death <-trunc(Data_People[Data_People$month==time,'DeathCost'])

Costs_arrest <- trunc(Data_People[Data_People$month==time,'ChargeCostCum'])

Costs_total <- format_dollars(Costs_arrest+Costs_death)

Costs_arrest <- format_dollars(Costs_arrest)

Costs_death <- format_dollars(Costs_death)


output$StateText<- renderText({
  paste("The population that reported illicit drug use (non-marijuana) in ", input$costarrest,  " is",
        prettyNum(N_pop1, big.mark = ","), ", the average cost of a month in prison in ", input$costarrest, "is ", format_dollars(Cost_Jail), ".",
        Arrest_text1, "leads to an annual arrest rate of", Arrest_text2)
})

output$Deaths_incid <- renderValueBox({
  valueBox(prettyNum(Deaths_incid, big.mark = ","), "Arrests in population with unknown fentanyl possession",
           #icon = icon("skull"),
           color = "red")
})

output$Deaths_reg <- renderValueBox({
  valueBox(prettyNum(Deaths_reg, big.mark = ","), "Deaths in population with known fentanyl possession",
           icon = icon("skull"),
           color = "red")
})

output$Arrests_incid <- renderValueBox({
  valueBox(prettyNum(Arrests_incid, big.mark = ","), "Arrests in population with unknown fentanyl possession",
           #icon = icon("trailer"),
           color = "orange")
})

output$Arrests_reg <- renderValueBox({
  valueBox(prettyNum(Arrests_reg, big.mark = ","), "Arrests in population with known fentanyl possession",
           #icon = icon("trailer"),
           color = "orange")
})

output$Costs_total <- renderValueBox({
  valueBox(Costs_total, "Total costs from death and arrest",
           #icon = icon("dollar"),
           color = "green")
})

output$Costs_death <- renderValueBox({
  valueBox(Costs_death, "Total costs from death",
           #icon = icon("dollar"),
           color = "green")
})


output$Costs_arrest <- renderValueBox({
  valueBox(Costs_arrest, "Total costs from arrest",
           #icon = icon("dollar"),
           color = "green")
})
})
})
UI:
library(shiny)
library(shinydashboard)
library(scales)
library(tidyverse)
library(plotly)UI for shiny app looking at felonization of fentanyl posession
input_element_color <- "primary"
highlight_color <- "navy"
regular_color <- "navy"header <- dashboardHeader(
tags$li(
class = "dropdown"),
title = "Effects of policy felonizing fentanyl possession", titleWidth = 500
)sidebar <- dashboardSidebar(
sidebarMenu(
id = "sidebar",
menuItem("Dashboard", tabName = "dashboard", icon = icon("dashboard")),
menuItem("Source Code", icon = icon("file-code-o"),
href = ),
menuItem("Original Spreadsheet", icon = icon("google-drive"), href=),
menuItem("References", tabName = "references", icon = icon("book"))
)
)body <- dashboardBody(
tags$head(tags$style(HTML('
/* logo */
.skin-blue .main-header .logo {
background-color: #08306b;
}/* logo when hovered */ .skin-blue .main-header .logo:hover { background-color: #08306b; } /* navbar (rest of the header) */ .skin-blue .main-header .navbar { background-color: #deebf7; } /* main sidebar */ .skin-blue .main-sidebar { background-color: #08306b; } /* active selected tab in the sidebarmenu */ .skin-blue .main-sidebar .sidebar .sidebar-menu .active a{ color: #eff3ff; background-color: #084594; } /* other links in the sidebarmenu */ .skin-blue .main-sidebar .sidebar .sidebar-menu a{ background-color: #c6dbef; color: #000000; } /* other links in the sidebarmenu when hovered */ .skin-blue .main-sidebar .sidebar .sidebar-menu a:hover{ background-color: #fcfbfd; } /* toggle button when hovered */ .skin-blue .main-header .navbar .sidebar-toggle:hover{ background-color: #084594; } .box.box-solid.box-primary>.box-header {#color:#000000;
background:#08306b
}.box.box-solid.box-primary{
border-bottom-color:#807dba;
border-left-color:#c6dbef;
border-right-color:#c6dbef;
border-top-color:#c6dbef;}
                          '))),


#     tags$style(HTML("
#
#


#                                   ")),


tabItems(
    tabItem(
        # MAIN DASHBOARD ---------------------------------------------------
        tabName = "dashboard",
        ## INPUTS --------
        column(width = 4,
               ## Population
               box(title = "Inputs", width = NULL, solidHeader = TRUE, status = input_element_color,
                   collapsible = TRUE, collapsed = FALSE,
                   selectInput("costarrest",
                               ("State"),
                               choices= c(paste(as.character(state.name)),"US Average"), selected="Colorado") ,

                   selectInput("atRisk", ("How much fentanyl is a felony?"),
                               choices = list("Greater than 4g" = 1, "Greater than 1g" = 2,
                                              "Any amount" = 3), selected = 1),

                   selectInput("timeframe", ("Length of simulation?"),
                               choices = list("One year" = 1, "Five years" = 5,
                                              "Ten years" = 10), selected = 10),

                   sliderInput("propFentanyl",
                               ("Proportion of the illicit drug supply that contains fentanyl"),
                               min=0, max=1, value=0.8),

                   sliderInput("PropIncid",
                               ("Proportion of the overall population who uses illicit drugs that knowingly possess fentanyl"),
                               min=0, max=1, value=0.5),

                   selectInput("Arrests",
                               ("Policing strategy"),
                               choices= list("Standard Policing"= 0.13, "Aggressive Policing"= 0.3,
                                             "Treatment-informed Policing"=0.05), selected= "Standard Policing"),

                   selectInput("costdeath",
                               ("Costs associated with a death"),
                               choices= list("Healthcare costs only", "Lost productivity costs only",
                                             "Value of a statistical life"), selected= "Value of a statistical life")
               )
        ),

        ## OUTPUT: plot and metrics --------

        column(width = 8,
               fluidRow(box(textOutput("StateText"), width=8,background="navy")),
               fluidRow(
                   valueBoxOutput("Deaths_incid", width = 4),
                   valueBoxOutput("Deaths_reg", width = 4)),

               fluidRow(valueBoxOutput("Arrests_incid", width = 4),
                        valueBoxOutput("Arrests_reg", width = 4),
               ),
               fluidRow(
                   valueBoxOutput("Costs_arrest", width = 8),
                   valueBoxOutput("Costs_death", width = 6)),

               fluidRow(valueBoxOutput("Costs_total", width = 8)),

               fluidRow(plotlyOutput("I_plot"), width = 400)
        )
    ),
    ## References ----------------------------------------------------------
    tabItem(
        tabName = "references"
    )
)
)
ui <- dashboardPage(header, sidebar, body)