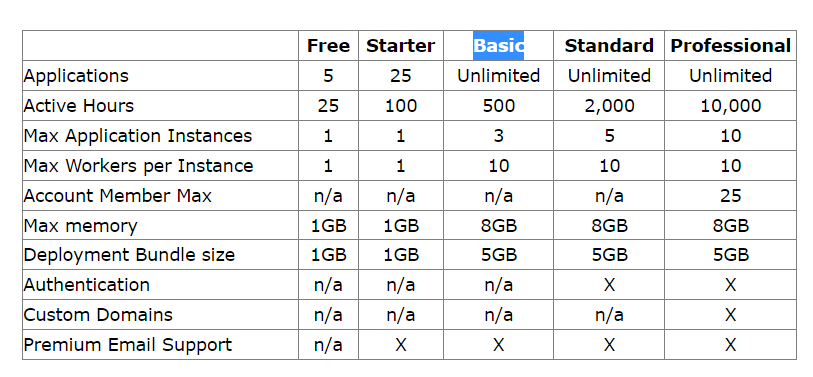
I keep encountering this error when running my app in shinyapps.io. -> Container event from container-8169095: oom (out of memory). I am using the basic plan. I am working with large raster datasets(I am trying to create a shiny app that calculates the total population of people within FAO farming system boundaries for all the countries in the world. I am also calculating mean farming yields for 42 crops which are all 1Gb in size), performing calculations that require a lot of RAM. Here is my code. If you are able to help, kindly assist. I've been stuck for days.
library(shiny)
library(shinythemes)
library(sf)
library(dplyr)
library(rgdal)
library(terra)
library(leaflet)
library(leaflet.extras)
Read Africa countries shapefile and transform to WGS84
gadm_sf <- st_read("Africa_countries.shp") %>%
st_transform("+init=EPSG:4326") %>%
st_make_valid()
Load farming system boundaries from FAO and transform to WGS84
fao_sf <- st_read("fao_gadm_intersect.shp") %>%
st_transform("+init=EPSG:4326") %>%
st_make_valid()
Load WorldPop population dataset and transform to WGS84
wp_path <- "H:\CIMMYT Shiny project\Data_2\AFR_PPP_2020_adj_v2.tif"
worldpop_pop <- terra::rast(wp_path)
Set the CRS of fao_sf to match worldpop_pop
fao_sf <- st_transform(fao_sf, st_crs(worldpop_pop))
Set the CRS of fao_sf to match worldpop_pop
gadm_sf <- st_transform(gadm_sf, st_crs(worldpop_pop))
#load spam dataset
physical area from SPAM 2010
mylist <- list.files(pattern="._A.tif$")
r <- rast(mylist)
crop extent to gadm_sf
spam_yield <- terra::crop(r, gadm_sf)
sum crop area for all 42 crops
agext <- sum(spam_yield)
#Define the UI
ui <- bootstrapPage(
navbarPage(
theme = shinytheme("flatly"), collapsible = TRUE, id = "nav",
HTML('Agri population mapper'),
windowTitle = "Agricultural population calculator",
tabPanel("Calculate Population",
fluidRow(
column(
width = 4,
selectInput(
inputId = "country",
label = tags$span("Select Country",
style = "cursor: help;",
title = "Select the country for which you want to calculate agricultural population. The data available includes information on the farming system and the population density of different administrative levels."),
choices = unique(gadm_sf$ADM0_NAME)
)
),
column(
width = 4,
selectInput(
inputId = "farming_system",
label = tags$span("Select Farming System",
style = "cursor: help;",
title = "Select the farming system for which you want to calculate agricultural population. The available options depend on the country selected."),
choices = NULL
)
),
column(
width = 4,
actionButton(
inputId = "calculate",
label = "Calculate Population"
)
)
),
hr(),
h3("Results"),
tableOutput(outputId = "result_table"),
leafletOutput(outputId = "result_map")
),
tabPanel("Data",
         numericInput(inputId = "maxrows", label = "Rows to show", value = 25),
         "This tool uses data provided by ",
         tags$a(href = "https://gadm.org/data.html", "GADM"),
         ", ",
         tags$a(href = "http://www.fao.org/geonetwork/srv/en/main.home", "FAO"),
         ", ",
         tags$a(href = "https://www.worldpop.org/", "WorldPop"),
         ", and ",
         tags$a(href = "https://data.apps.fao.org/catalog/iso/59f7a5ef-2be4-43ee-9600-a6a9e9ff562a", "SPAM"),
         "."
),

tabPanel("About this site",
         tags$div(
           tags$h4("What is the Agricultural Population Mapper?"),
           "The Agricultural Population Mapper is a tool that allows you to estimate the population living in rural areas and engaged in different farming systems in a given country.",
           tags$br(), tags$br(),
           tags$h4("How can I use it?"),
           "To use the Agricultural Population Mapper, simply select the country and farming system you're interested in and click the 'Calculate Population' button. The tool will return a table and a map showing the population and population density of different administrative levels within the selected country and farming system.",
           tags$br(), tags$br(),
           tags$h4("Code"),
           "Code and input data used to generate this Shiny mapping tool are available on ",
           tags$a(href="https://github.com/Madaga-L/Agri-population-calculator", "Github."),
           tags$br(),tags$br(),
           tags$h4("Acknowledgements"),
           "This app was developed by CIMMYT as part of Ex Ante Evaluation Support to Prospective Agronomy Interventions."
         )
)
)
)
Define Server
Define Server
server <- function(input, output, session) {
Update farming system choices based on selected country
observeEvent(input$country, {
country_name <- input$country
farming_system_choices <- unique(fao_sf$DESCRIPTIO[fao_sf$ADM0_NAME == country_name])
updateSelectInput(session, "farming_system", choices = farming_system_choices)
})
Calculate agricultural population and yield based on user selections
observeEvent(input$calculate, {
country_name <- input$country
farming_system_name <- input$farming_system
farming_system_geom <- fao_sf[fao_sf$DESCRIPTIO == farming_system_name & fao_sf$ADM0_NAME == country_name, ]
country_geom <- gadm_sf[gadm_sf$ADM0_NAME == country_name, ]
farming_system_geom <- fao_sf[fao_sf$DESCRIPTIO == farming_system_name & fao_sf$ADM0_NAME == country_name, ]
intersection_extent <- st_intersection(country_geom, farming_system_geom)

##create a new raster object rr using the same resolution and extent as the worldpop_pop raster, but based on the geometry of the farming_system_geom.
rr <- terra::rast(intersection_extent, resolution = res(worldpop_pop), ext = ext(worldpop_pop))

##rasterize the farming system geometry to be used in masking
farming_system_raster <- terra::rasterize(intersection_extent, field = "gridcode", rr, fun = "sum", overwrite = TRUE)

#mask population based on farming system selected
worldpop_pop_mask <- terra::mask(worldpop_pop, farming_system_raster)

# Resample spam_yield to have the same extent as worldpop_pop
spam_yield_resampled <- terra::resample(agext, rr)

spam_yield_mask <- terra::mask(spam_yield_resampled, farming_system_raster)

total_population_sum <- sum(as.vector(worldpop_pop_mask), na.rm = TRUE)
mean_population <- mean(as.vector(worldpop_pop_mask), na.rm = TRUE, FUN = mean)
mean_yield <- mean(as.vector(spam_yield_mask), na.rm = TRUE, FUN = mean)

output$result_table <- renderTable({
  data.frame("Total_Population" = total_population_sum,
             "mean_Population" = mean_population,
             "mean_SPAM_Yield" = mean_yield)
})

# convert SpatRaster to rasterLayer object
worldpop_pop_mask_raster <- raster(worldpop_pop_mask)

pal0 <- colorNumeric(c("RdYlBu"), na.omit(values(worldpop_pop_mask_raster)),
                     na.color = "transparent")

output$result_map <- renderLeaflet({
  leaflet() %>%
    addProviderTiles("CartoDB.Positron") %>%
    addRasterImage(worldpop_pop_mask_raster, colors = pal0, opacity = 0.9) %>%
    addLegend(pal = pal0, values = values(worldpop_pop_mask_raster),
              title = "Population",
              position = "bottomright")
})
})
}
Run the app
shinyApp(ui = ui, server = server)