Shiny Dashboard Tabbox Footer

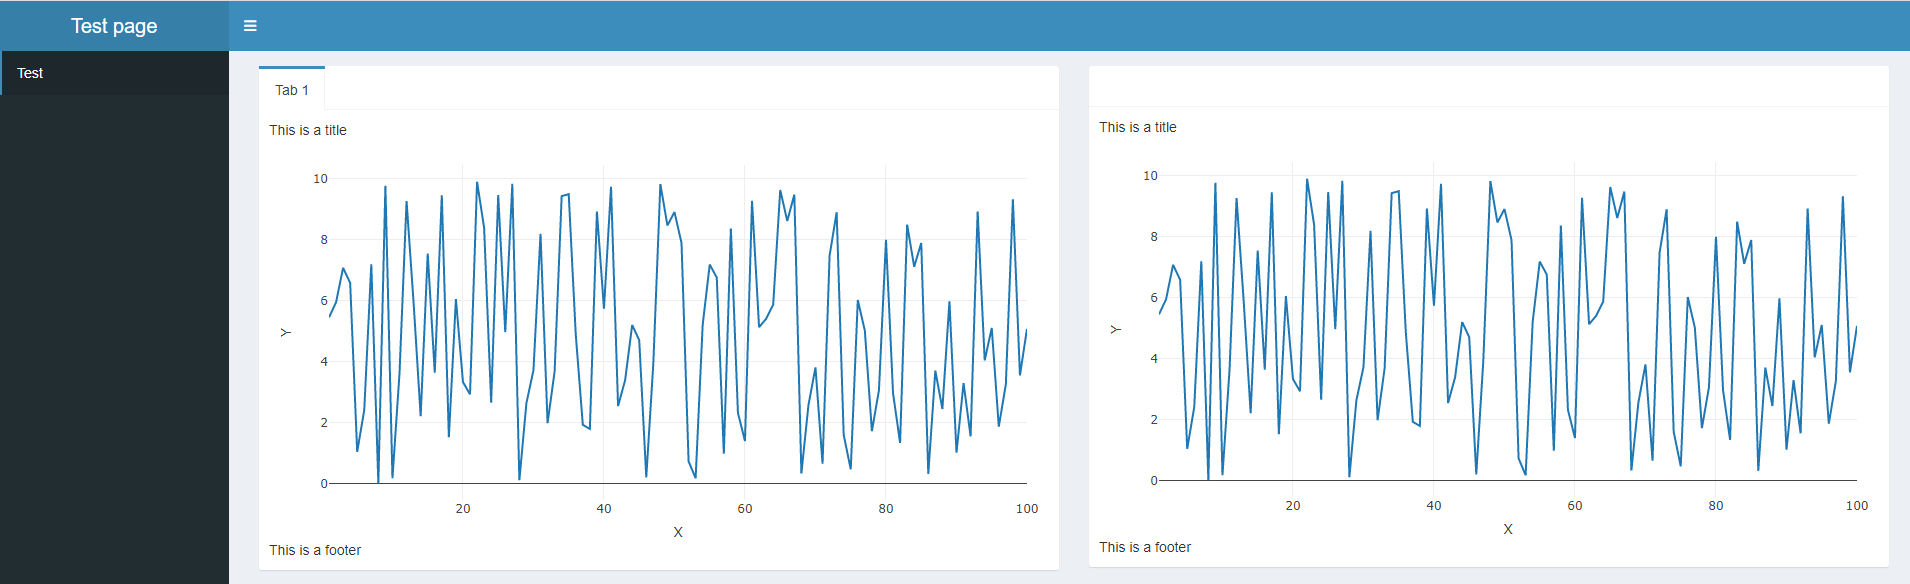
In my dashboard I am using some tabBox elements, and in them I have footers. The footer is too close to the edge of the tabBox:

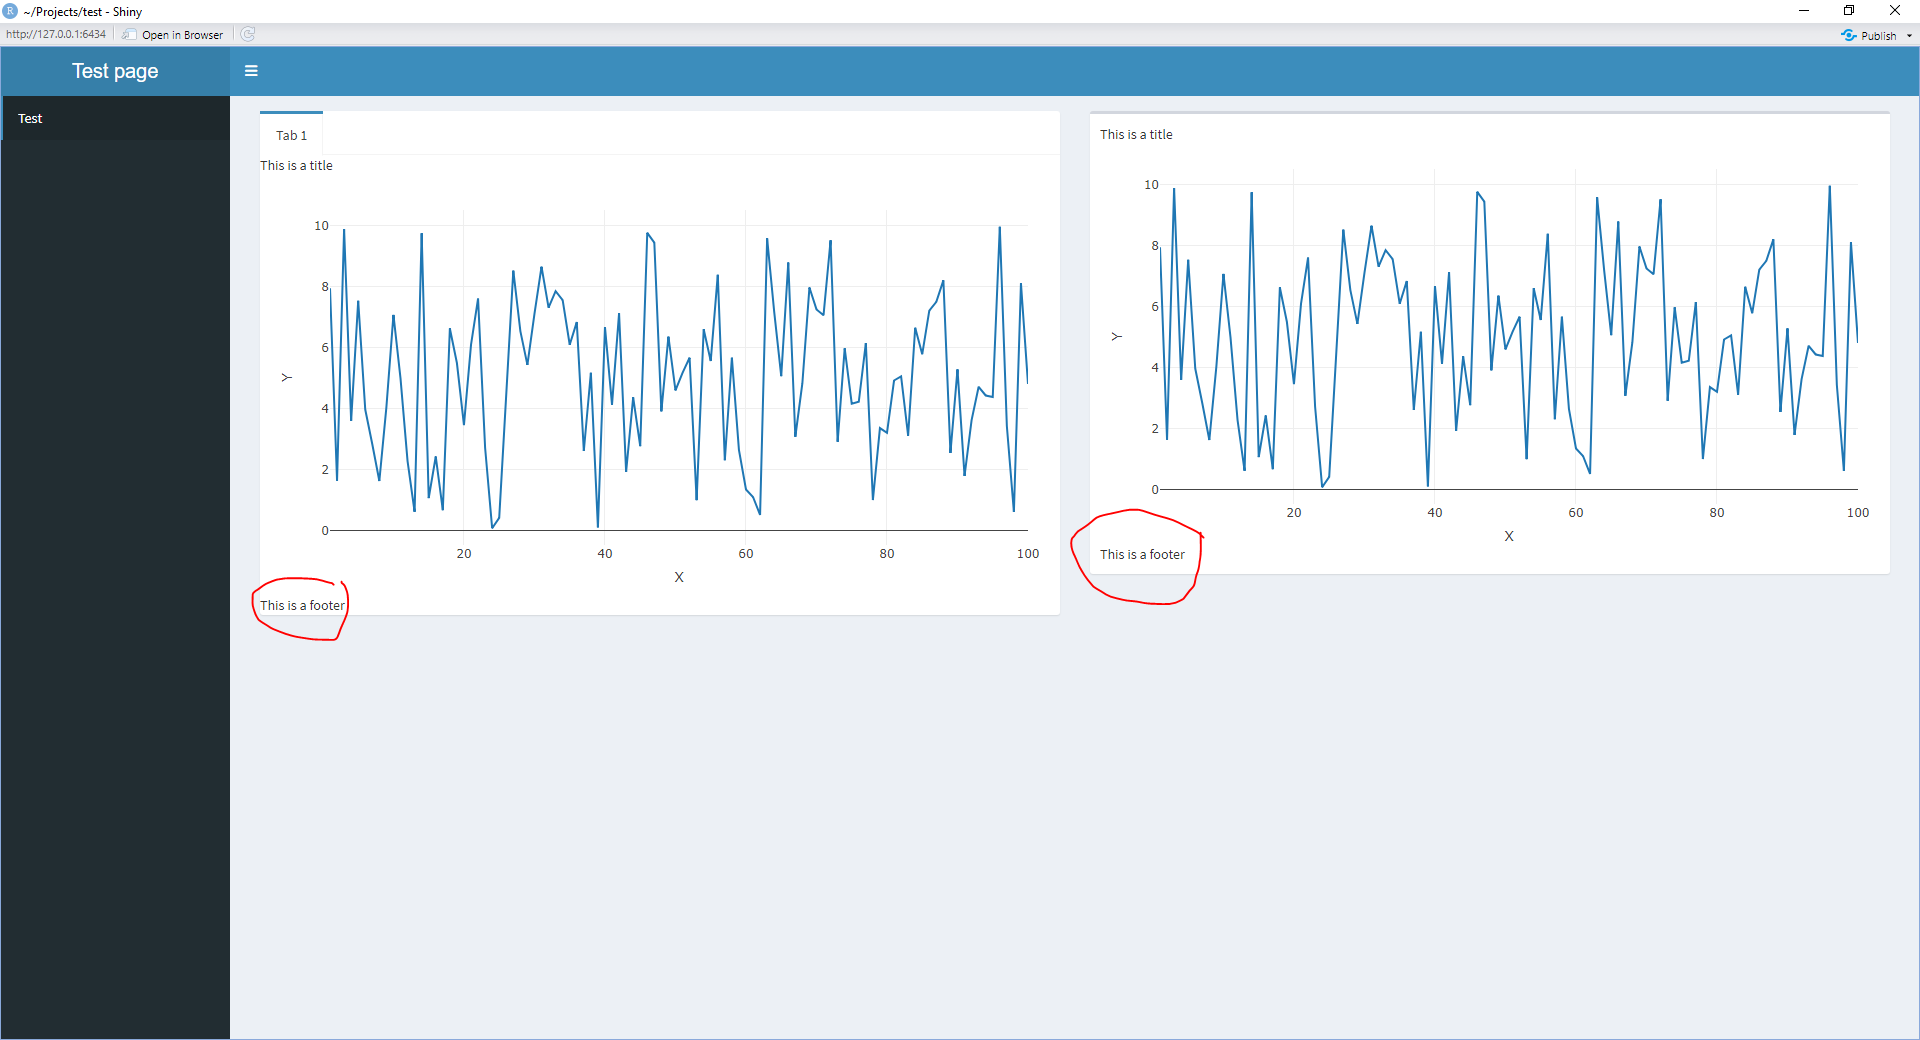
I don't have this issue in a regular box element since the footer is inside a column inside a fluidRow inside a box whereas in a tabBox, the footer is an argument that can be passed to the tabBox.

Reprex:

library(shiny)
library(shinydashboard)
library(plotly)

data <- data.frame("X" = c(1:100), "Y" = runif(100, 0, 10))

ui <- dashboardPage(
  dashboardHeader(title = "Test page"),
  dashboardSidebar(sidebarMenu(menuItem("Test", tabName = "tab_test"))),
  dashboardBody(
    tabItems(
      tabItem(
        tabName = "tab_test",
        tabBox(
          header = fluidRow(column(width = 12, "This is a title")),
          tabPanel("Tab 1", plotlyOutput('Plot1')),
          footer = fluidRow(column(width = 12, "This is a footer"))
        ),
        box(
          fluidRow(column(width = 12, "This is a title")),
          tabPanel("Tab 1", plotlyOutput('Plot2')),
          fluidRow(column(width = 12, "This is a footer"))
        )
      )
    )
  )
)

server <- function(input, output, session) {
  output$Plot1 <- renderPlotly({
    p <- plot_ly(data, x = ~X, y = ~Y, type = "scatter", mode = "lines")
  })
  output$Plot2 <- renderPlotly({
    p <- plot_ly(data, x = ~X, y = ~Y, type = "scatter", mode = "lines")
  })
}

shinyApp(ui, server)

How can I increase border between the footer and the edge of the tabBox so that it looks like the footer in the box?

Please see ?shinydashboard::tabBox - it doesn't have a header or footer parameter.

We can simply pass them as UI elements in tabPanel:

library(shiny)
library(shinydashboard)
library(plotly)

data <- data.frame("X" = c(1:100), "Y" = runif(100, 0, 10))

ui <- dashboardPage(
  dashboardHeader(title = "Test page"),
  dashboardSidebar(sidebarMenu(menuItem("Test", tabName = "tab_test"))),
  dashboardBody(
    tabItems(
      tabItem(
        tabName = "tab_test",
        tabBox(
          tabPanel("Tab 1",
                   fluidRow(column(width = 12, "This is a title")),
                   plotlyOutput('Plot1'),
                   fluidRow(column(width = 12, "This is a footer"))
                   )
        ),
        box(
          fluidRow(column(width = 12, "This is a title")),
          tabPanel("Tab 1", plotlyOutput('Plot2')),
          fluidRow(column(width = 12, "This is a footer"))
        )
      )
    )
  )
)

server <- function(input, output, session) {
  output$Plot1 <- renderPlotly({
    p <- plot_ly(data, x = ~X, y = ~Y, type = "scatter", mode = "lines")
  })
  output$Plot2 <- renderPlotly({
    p <- plot_ly(data, x = ~X, y = ~Y, type = "scatter", mode = "lines")
  })
}

shinyApp(ui, server)

So the reason this isn't optimal for me is because my code is modular and my footnote and my titles are not static. I apologize, I probably should have mentioned that originally.

Since shiny doesn't like calling the same output from more than one location, it means I would essentially have to add in a duplicate function to call for each tab to print the same thing. I've done this in the code below. It does fix the issue, but I feel like there has to be some other solution to this.

library(shiny)
library(shinydashboard)
library(plotly)

my_tabBox_UI <- function(id) {
  ns <- NS(id)
  
  tabBox(
    tabPanel("Tab 1", textOutput(ns("Title1")), plotlyOutput(ns("Plot1")), textOutput(ns("Footer1"))),
    tabPanel("Tab 2", textOutput(ns("Title2")), plotlyOutput(ns("Plot2")), textOutput(ns("Footer2"))),
  )
}

my_tabBox_Server <- function(id, df) {
  moduleServer(id, function(input, output, session) {
    output$Title1 <- renderText({
      t <- paste("There are ", nrow(df), " samples in this graph.", sep = "")
    })
    output$Title2 <- renderText({
      t <- paste("There are ", nrow(df), " samples in this graph.", sep = "")
    })
    
    output$Plot1 <- renderPlotly({
      p <- plot_ly(df, x = ~X, y = ~Y, type = "scatter", mode = "lines")
    })
    output$Plot2 <- renderPlotly({
      p <- plot_ly(df, x = ~X, y = ~Y, type = "scatter", mode = "lines")
    })
    
    output$Footer1 <- renderText({
      t <- paste("There are ", sum(df$Y), ".", sep = "")
    })
    output$Footer2 <- renderText({
      t <- paste("There are ", sum(df$Y), ".", sep = "")
    })
  })
}

data1 <- data.frame("X" = c(1:100), "Y" = runif(100, 0, 10))
data2 <- data.frame("X" = c(1:100), "Y" = runif(100, 0, 10))

ui <- dashboardPage(
  dashboardHeader(title = "Test page"),
  dashboardSidebar(sidebarMenu(menuItem("Test", tabName = "tab_test"))),
  dashboardBody(
    tabItems(
      tabItem(
        tabName = "tab_test",
        my_tabBox_UI("box1"),
        my_tabBox_UI("box2")
      )
    )
  )
)

server <- function(input, output, session) {
  my_tabBox_Server("box1", data1)
  my_tabBox_Server("box2", data2)
}

shinyApp(ui, server)

You could reduce the code using renderUI:

library(shiny)
library(shinydashboard)
library(plotly)

my_tabBox_UI <- function(id) {
  ns <- NS(id)
  uiOutput(ns("tabBoxOut"))
}

my_tabBox_Server <- function(id, df) {
  moduleServer(id, function(input, output, session) {
    ns <- NS(id)
    output$Plot1 <- output$Plot2 <- renderPlotly({
      p <- plot_ly(df, x = ~X, y = ~Y, type = "scatter", mode = "lines")
    })
    output$tabBoxOut <- renderUI({
      tabBox(
        tabPanel("Tab 1", paste("There are ", nrow(df), " samples in this graph.", sep = ""), plotlyOutput(ns("Plot1")), paste("There are ", sum(df$Y), ".", sep = "")),
        tabPanel("Tab 2", paste("There are ", nrow(df), " samples in this graph.", sep = ""), plotlyOutput(ns("Plot2")), paste("There are ", sum(df$Y), ".", sep = "")),
      )
    })
    
  })
}

data1 <- data.frame("X" = c(1:100), "Y" = runif(100, 0, 10))
data2 <- data.frame("X" = c(1:100), "Y" = runif(100, 0, 10))

ui <- dashboardPage(
  dashboardHeader(title = "Test page"),
  dashboardSidebar(sidebarMenu(menuItem("Test", tabName = "tab_test"))),
  dashboardBody(
    tabItems(
      tabItem(
        tabName = "tab_test",
        my_tabBox_UI("box1"),
        my_tabBox_UI("box2")
      )
    )
  )
)

server <- function(input, output, session) {
  my_tabBox_Server("box1", data1)
  my_tabBox_Server("box2", data2)
}

shinyApp(ui, server)

You can further reduce the code by using lapply etc. (at the expense of readability):

library(shiny)
library(shinydashboard)
library(plotly)

my_tabBox_UI <- function(id) {
  ns <- NS(id)
  uiOutput(ns("tabBoxOut"))
}

my_tabBox_Server <- function(id, df) {
  moduleServer(id, function(input, output, session) {
    ns <- NS(id)
    output$Plot1 <- output$Plot2 <- renderPlotly({
      p <- plot_ly(df, x = ~X, y = ~Y, type = "scatter", mode = "lines")
    })
    output$tabBoxOut <- renderUI({
      do.call(tabBox, lapply(1:2, function(x){tabPanel(paste("Tab", x), paste("There are ", nrow(df), " samples in this graph.", sep = ""), plotlyOutput(ns(paste0("Plot", x))), paste("There are ", sum(df$Y), ".", sep = ""))}))
    })
  })
}

data1 <- data.frame("X" = c(1:100), "Y" = runif(100, 0, 10))
data2 <- data.frame("X" = c(1:100), "Y" = runif(100, 0, 10))

ui <- dashboardPage(
  dashboardHeader(title = "Test page"),
  dashboardSidebar(sidebarMenu(menuItem("Test", tabName = "tab_test"))),
  dashboardBody(
    tabItems(
      tabItem(
        tabName = "tab_test",
        lapply(list("box1", "box2"), my_tabBox_UI)
      )
    )
  )
)

server <- function(input, output, session) {
  mapply(my_tabBox_Server, id = list("box1", "box2"), df = list(data1, data2))
}

shinyApp(ui, server)

This topic was automatically closed 7 days after the last reply. New replies are no longer allowed.

If you have a query related to it or one of the replies, start a new topic and refer back with a link.