How can I use geom_vline for interactive shiny app for area or line plot?
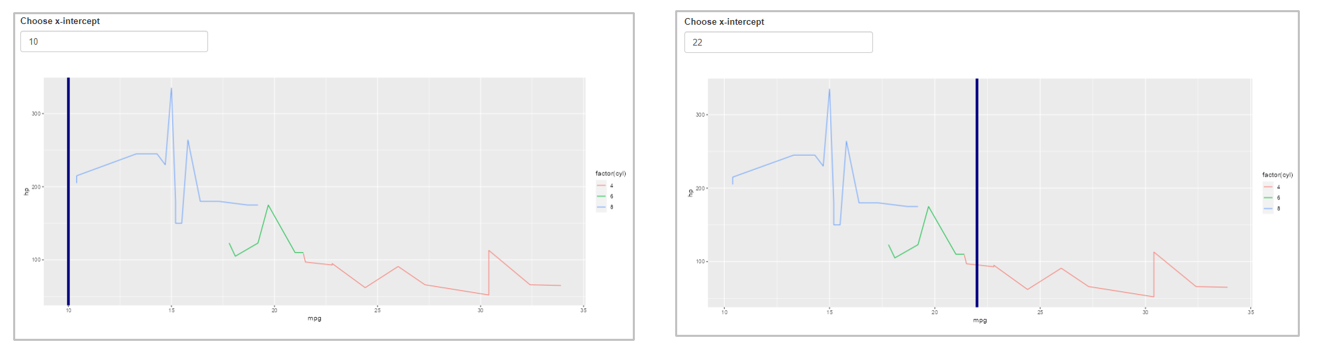
Welcome to the community @parth77! Below is an example app that creates a line plot of the mtcars dataset with an input for changing the position of the vertical line. To make it interactive, when creating the plot, pass the id of your input (input$intercept in this case) to the xintercept argument of geom_vline().
library(shiny)

ui <- fluidPage(
  br(),
  numericInput('intercept', 'Choose x-intercept', value = 10, min = 10, max = 34),
  br(),
  plotOutput('myplot')
)

server <- function(input, output, session) {

  output$myplot = renderPlot({
    ggplot(mtcars, aes(x = mpg, y = hp)) +
      geom_line(aes(group = cyl, color = factor(cyl))) +
      geom_vline(xintercept = input$intercept, linewidth = 2, color = 'navyblue')
  })

}

shinyApp(ui, server)
A couple different outcomes below.
Thank you @scottyd22 for quick reply on the query.
Actually, I wanted to have such line one cursor hovering.
This exactly what I want:
Hi Parth!
You can achieve this with {plotly} (a great pkg for interactive graphs).
This simple example shows the "on-hover" interactive vertical line (similar to what you shared above):
# Make sure to have plotly installed before running the following code with:  `install.packages("plotly")`
library(plotly)
library(shiny)


my_data <- data.frame(
  x = seq(100),
  y = rnorm(100)
)

ui <- fluidPage(
  h1("Simple Plotly graph in Shiny"),
  plotlyOutput("graph")
)

server <- function(input, output, session) {
  output$graph <- renderPlotly({
    plot_ly(
      my_data,
      x = ~x,
      y = ~y,
      name = "data",
      type = "scatter",
      mode = "lines"
    )  %>%
      layout(hovermode = "x unified")
  })
}

shinyApp(ui, server)
Note, this example doesn't even require a Shiny app by itself, but I imagine that you probably are going to add some other elements, so I just wrapped it into a Shiny app.
Hope this helps ![]()
Cheers!
This post was published by an Appsilon team member. Our company can help you get the most out of RShiny and Posit/RStudio products.
Check our open positions here.
Appsilon: Building impactful RShiny Dashboards and providing R coding services.

2 Likes
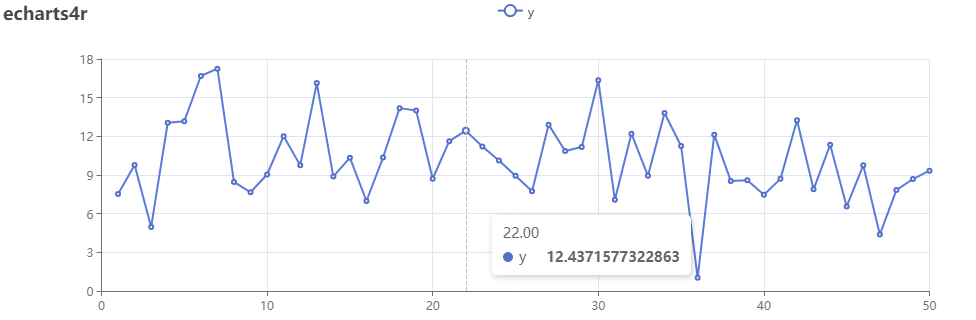
In addition to @agus's recommendation (plotly is great!), the echarts4r package is another useful option for interactive visuals.
library(echarts4r)

df <- data.frame(
  x = seq(50),
  y = rnorm(50, 10, 3)
)

df |>
  e_charts(x) |>
  e_line(y) |>
  e_tooltip(trigger = "axis") |>
  e_title("echarts4r")
2 Likes
Thank you @scottyd22 and @agus,
Both the solutions were awesome. I am going to explore further these libraries.
Thanks a lot again.
Parth
Thank you @agus ,
This is what I was looking for.
I will further explore these libraries.
Thanks again,
Parth
1 Like
This topic was automatically closed 7 days after the last reply. New replies are no longer allowed.
If you have a query related to it or one of the replies, start a new topic and refer back with a link.