Help building an app that generates summary statistics

Hello

Trying to create a dashboard to upload csv files and get summary statistics of each variable.
Below is my UI and server codes.

library(shiny)
library(shinydashboard)
shinyUI(
  dashboardPage(
  dashboardHeader(title="Feedback Analysis"),
  dashboardSidebar(
    fileInput("file","Upload CSV files",multiple=TRUE,accept=("text/comma")),
    sidebarMenu(id="tabs",
      menuItem("Data",tabName="Data",icon=icon("table"),startExpanded = TRUE),
      menuItem("Summary statistics",tabName="Feedback Summary")
    )
  ),
  dashboardBody(
    tabItems(
      tabItem(tabName="Data",tableOutput("data.frame")),
      tabItem(tabName="Feedback Summary")
    )
  )
)
)

library(shiny)
library(shinydashboard)

server<-shinyServer(function(input,output){
  values <- reactive({
    values$df_data <- read.csv(input$file$datapath,header=TRUE)
  })
  
  output$data.frame <- renderTable(values$df_data)
})

Getting below error in the dashboard.


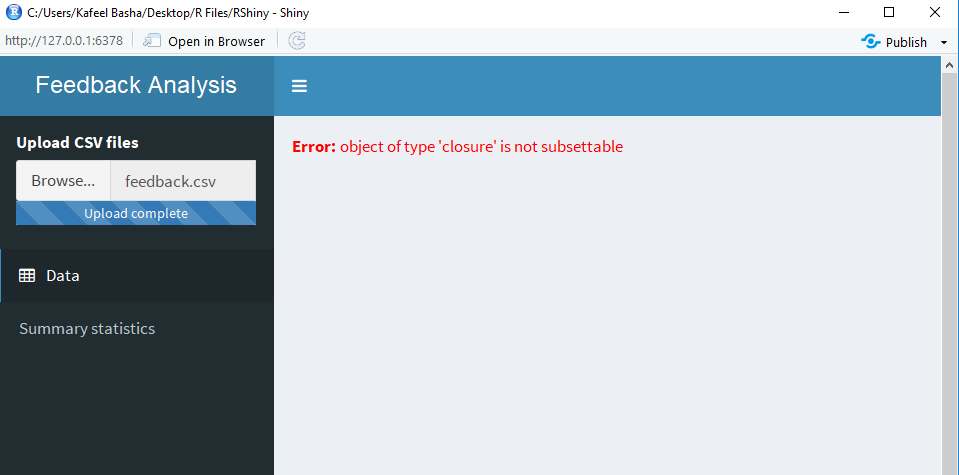
Basically I trying to create two tab Items, first one should contain the data set and second should contain summary statistics. How can I use selecInput() to get summary of each variable by selecting one by one.

I was able to upload the file and look at the data in a separate tab, but have problem while analyzing the data, below are the updated codes I am trying to run.

library(shiny)
library(shinydashboard)
shinyUI(
  dashboardPage(
  dashboardHeader(title="Feedback Analysis"),
  dashboardSidebar(
    fileInput("file","Upload CSV files",multiple=TRUE,accept=("text/comma")),
    sidebarMenu(id="tabs",
      menuItem("Data",tabName="Data",icon=icon("table"),startExpanded = TRUE),
      menuItem("Summary statistics",selectInput("Question",h1("Response to be analysed"),
                              choices=names(values$df_data),selected=values$df_data[,1]),
               tabName="Feedback Analysis")
    )
  ),
  dashboardBody(
    tabItems(
      tabItem(tabName="Data", h2("Data Set"),tableOutput("data.frame")),
      tabItem(tabName="Feedback Summary",h3("Feedback Analysis"),
      fluidRow(
        infoBoxOutput("rcount")
      ))
    )
  )
)
)

library(shiny)
library(shinydashboard)
library(dplyr)

server<-shinyServer(function(input,output){
  values <- reactiveValues(df_data = NULL)
  
  observeEvent(input$file, {
    values$df_data <- read.csv(input$file$datapath)
  })
  
  observeEvent(input$Go, {
    temp <- values$df_data[-input$Delete, ]
    values$df_data <- temp
    
  })
  output$data.frame <- renderTable(values$df_data)
  output$rcount<-renderValueBox(table(values$df_data[,11]),"Response Count")
    })

Getting below error.


Please help.

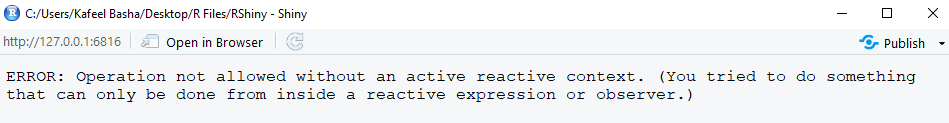
the issue here is that you're trying to plot a reactive dataframe/value, but are not referring to it correctly.

I'd guess its where you output$dataframe, values is reactive, so you have to call values( ), with the brackets like that as it is a reactive. or values()$df_data.

Hope it helps

Thank you for the response.

As per your suggestion, where ever i was using 'values', replaced with values(), this time getting different error.
image

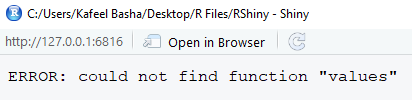
okay - make sure it is not called values() when you first assign it. it should be values<-reactive({...}) first, then after than values() whenever you're calling it - that might be why it thinks its a function.

Yes, tried with this but still the error persist.

If I'm reading it right, it looks like you are trying to use the column names from the object values as the selectInput options in the UI. You are receiving this error as the object values is defined within server making the names inaccessible in the shinyUI. The function updateSelectInput (see link below) will allow you to '"send" the names to the element selectInput as choices.

https://shiny.rstudio.com/reference/shiny/latest/updateSelectInput.html

The observeEvent for input$file would like something like this..

observeEvent(input$file, {

    # read data
    values$df_data <- read.csv(input$file$datapath)
    
    # update selectInput#Question
    updateSelectInput(session, inputId = "Question", choices = names(...), selected = ...)
})

Hope that helps!

Thank you for the response.

As per your suggestion, I have made changes to the code, please let me know where I am going wrong as I get same error.

library(shiny)
library(shinydashboard)
shinyUI(
  dashboardPage(
  dashboardHeader(title="Feedback Analysis"),
  dashboardSidebar(
    fileInput("file","Upload CSV files",multiple=TRUE,accept=("text/comma")),
    sidebarMenu(id="tabs",
      menuItem("Data",tabName="Data",icon=icon("table"),startExpanded = TRUE),
      menuItem("Descriptive Analysis",selectInput("Question",h1("Response to be analysed"),
                                                  choices=names(values$df_data),selected=values$df_data[,1]),
               tabName="Feedback Analysis")
    )
  ),
  dashboardBody(
    tabItems(
      tabItem(tabName="Data", h2("Data Set"),tableOutput("data.frame")),
      tabItem(tabName="Feedback Analysis",h3("Feedback Analysis"),
      tableOutput("rcount")                                             
      )
    )
  )
)
)

library(shiny)
library(shinydashboard)
library(dplyr)

server<-shinyServer(function(input,output,session){
  values <- reactiveValues(df_data = NULL)
observeEvent(input$file, {    
    # read data
    values$df_data <- read.csv(input$file$datapath)
    
    # update selectInput#Question
    updateSelectInput(session, inputId = "Question", choices=names(values$df_data),selected=values$df_data[,1])
  })

  observeEvent(input$Go, {
    temp <- values$df_data[-input$Delete, ]
    values$df_data <- temp

  })
  output$data.frame <- renderTable(values$df_data)
  output$rcount<-renderTable(table(input$Question),"Response Count")
})

I'm not sure if...

..is necessary. What happens when you read the data in as a reactive object? (See below)

server <- shinyServer(function(input,output,session){
    
    # observeEvent for input$file
    observeEvent(input$file, {
        
        # read file -- I set as values for consistency across posts
        values <- reactive({
            read.csv(input$file$datapath)    
        })
        
        # update selectInput#Question
        updateSelectInput(
            session,                         # specify the session
            inputId = "Question",            # select the id of the target elem
            choices=names(values()),         # colnames of  'values'
            selected=names(values())[1]      # select the first element in colnames of 'values'
        )
    })
    
    # observeEvent for input$Go
    observeEvent(input$Go, {
        temp <- values$df_data[-input$Delete, ]
        values$df_data <- temp
        
    })
    
    # render tables
    output$data.frame <- renderTable(values$df_data)
    output$rcount<-renderTable(table(input$Question),"Response Count")
    
})

EDIT: fixed a few typos and indentation

Thanks a lot for your instructions.

By using only reactive() function, either I get an error "could find function" or after uploading the data nothing displays in the tab as below

Can you please help me with an example how can I get summary by changing the variables, after uploading csv file?.Looks like I am missing something which causing the error.

I think we're almost there. There are few steps left.

server

I made a few changes to my previous reply.

Reading the file input does not need to be triggered by input$file. This should be defined outside of all observeEvents.

# first line in server
values <- reactive({ read.csv(input$file$datapath) })

Next,

I'm not sure if these lines are specific to the file you are working from, but values$df_data was replaced by values().

ui

After reading over the ui block, I noticed that the actionButton Go is missing. Perhaps this got accidentally cut somewhere in the previous comments. I added the button after the selectInput.

# button
actionButton(inputId = "Go",label = "Go")

The choices for selectInput should also be set to "" (blanks) as the content will be updated from the server (updateSelectInput). This would like this:

# input
selectInput(
    inputId = "Question",
    label = h1("Response to be analysed"),
    choices="",
    selected=""
)

Full example

I saved a sample dataset to my desktop

write.csv(mtcars, "~/Desktop/mtcars.csv",row.names = FALSE)
library(shiny)
library(shinydashboard)

# ui
ui <- shinyUI(
    dashboardPage(
        
        # header
        dashboardHeader(title="Feedback Analysis"),
        
        # sidebar
        dashboardSidebar(
            fileInput("file","Upload CSV files",multiple=TRUE,accept=("text/comma")),
            
            # sidebar menu
            sidebarMenu(id="tabs",
                        
                        # option
                        menuItem(text = "Data", tabName="Data", icon=icon("table"), startExpanded = TRUE),
                        
                        # option
                        menuItem("Descriptive Analysis", tabName="Feedback Analysis",
                                 
                                 # input
                                 selectInput(inputId = "Question",
                                             label = h1("Response to be analysed"),
                                             choices="",
                                             selected=""),
                                 
                                 # button
                                 actionButton(inputId = "Go",label = "Go")
                        )
            )
        ),
        
        # body
        dashboardBody(
            tabItems(
                
                # tab 1: data
                tabItem(tabName="Data", h2("Data Set"),tableOutput("data.frame")),
                
                # tab 2: rcount
                tabItem(tabName="Feedback Analysis",h3("Feedback Analysis"),
                        tableOutput("rcount")
                )
            )
        )
    )
)


server <- shinyServer(function(input,output,session){
    
    # read file
    values <- reactive({ read.csv(input$file$datapath) })
    
    
    # observeEvent for input$file
    observeEvent(input$file, {
        
        # update selectInput#Question
        updateSelectInput(
            session, 
            inputId = "Question",
            choices=names(values()),    
            selected=names(values())[1]
        )
        
    })
    
    # observeEvent for input$Go
    observeEvent(input$Go, {
        # temp <- values([-input$Delete, ]    # commented for now
        # values <- temp                      # commented for now
        
        # render tables
        output$data.frame <- renderTable(values())
        
        # commented for now
        # output$rcount <- renderTable(table(input$Question),"Response Count")
        
    })
    
})


shinyApp(ui, server)

I didn't assign any behaviors to transform the data before rendering as I'm not sure of the end goal. The above example should get the table to render after a file is uploaded and the Go button is clicked.

Yes we are almost there.

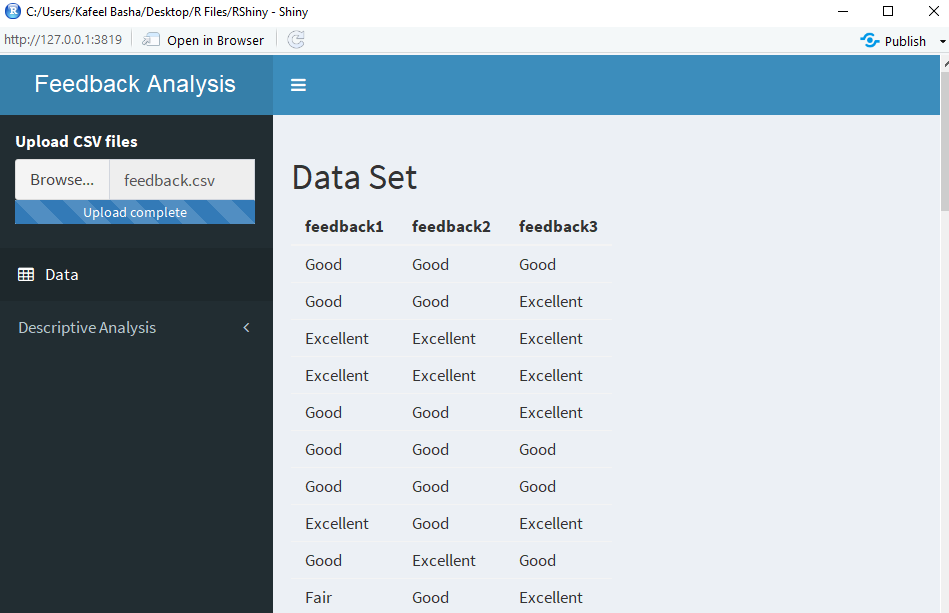
I am just trying to create two tabs, one should display the data set the moment we upload csv file.
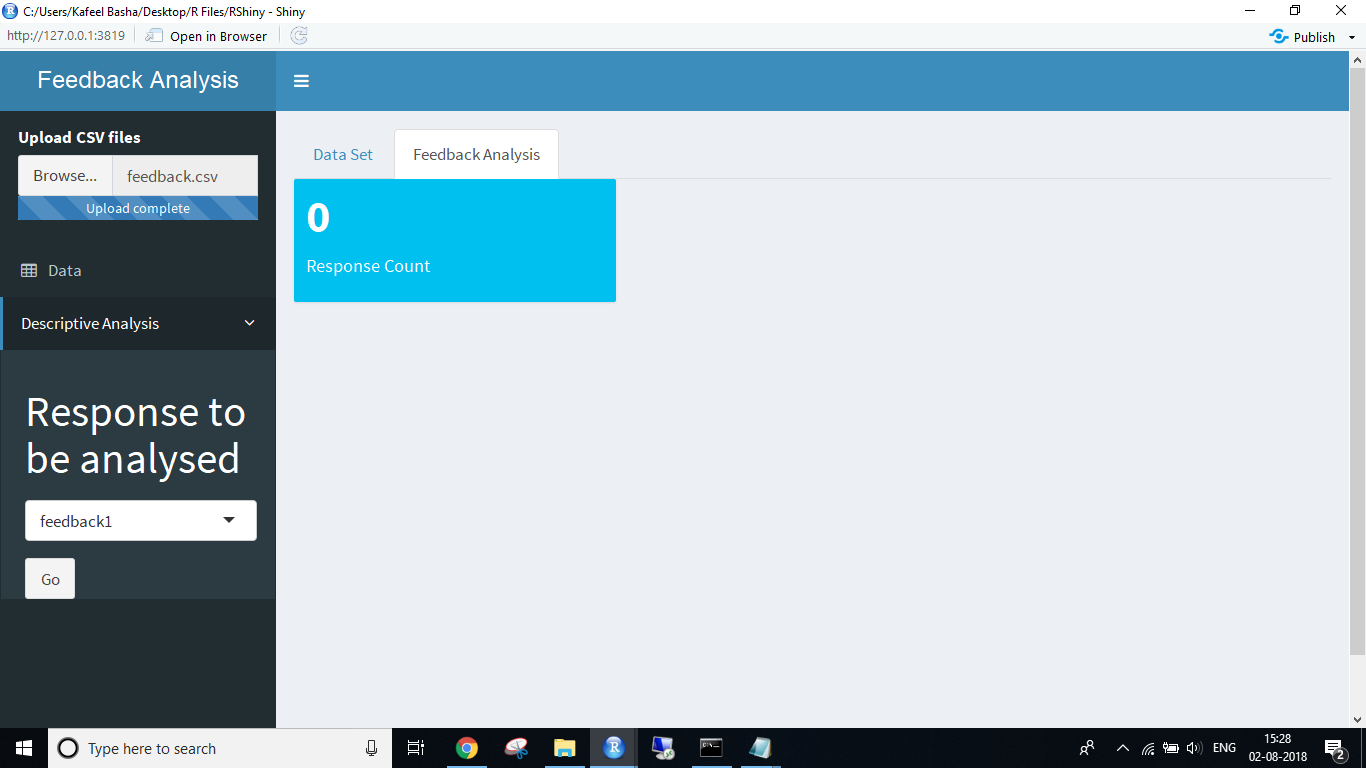
In second tab I am trying to display summary like count of number of times a variable has "Good" or "Bad" using fluidRow() and renderValueBox(). Also would like to display bar chart of frequencies for categories in the selected variable.

Here I am unable to see the data once I upload, and trying to display summary statistics.

I have done some basic changes. Please let me know where I am going wrong.

library(shiny)
library(shinydashboard)

# ui
ui <- shinyUI(
  dashboardPage(
    
    # header
    dashboardHeader(title="Feedback Analysis"),
    
    # sidebar
    dashboardSidebar(
      fileInput("file","Upload CSV files",multiple=TRUE,accept=("text/comma")),
      
      # sidebar menu
      sidebarMenu(id="tabs",
                  
                  # option
                  menuItem(text = "Data", tabName="Data", icon=icon("table"), startExpanded = TRUE),
                  
                  # option
                  menuItem("Descriptive Analysis", tabName="Feedback Analysis",
                           
                           # input
                           selectInput(inputId = "Question",
                                       label = h1("Response to be analysed"),
                                       choices="",
                                       selected=""),
                           
                           # button
                           actionButton(inputId = "Go",label = "Go")
                  )
      )
    ),
    
    # body
    dashboardBody(
      tabItems(
        
        # tab 1: data
        tabItem(tabName="Data", h2("Data Set"),tableOutput("data.frame")),
        
        # tab 2: rcount
        tabItem(tabName="Feedback Analysis",h3("Feedback Analysis"),
          fluidRow(
            valueBoxOutput("rcount")
          )
        )
      )
    )
  )
)

library(shinydashboard)
library(dplyr)
library(shiny)

server <- shinyServer(function(input,output,session){
  
  # read file
  values <- reactive({ read.csv(input$file$datapath) })
  
  
  # observeEvent for input$file
  observeEvent(input$file, {
    
    # update selectInput#Question
    updateSelectInput(
      session, 
      inputId = "Question",
      choices=names(values()),    
      selected=names(values())[1]
    )
    
  })
  
  # observeEvent for input$Go
  observeEvent(input$Go, {
    # temp <- values([-input$Delete, ]    # commented for now
    # values <- temp                      # commented for now
    
    # render tables
    output$data.frame <- renderTable(values())
    
    # commented for now
    output$rcount <- renderValueBox({
      valueBox(filter(input$Question=="Good"),"Response Count")})
    
  })
  
})

Thanks a lot.

Moving the output$data.table <- renderTable(...) into the observeEvent for input$file will do the trick.

# observeEvent for input$file
observeEvent(input$file, {
    
    # render tables at file upload
    output$data.frame <- renderTable(values())
    
    # update selectInput#Question
    updateSelectInput(
        session, 
        inputId = "Question",
        choices=names(values()),    
        selected=names(values())[1]
    )
    
})

This part depends on the structure of the data. This can be achieved by doing something along the lines of:

library(tidyverse)

output$rcount <- renderValueBox({
    
    # evaluate data: count, summarize, etc.
    sum_values <- values() %>%
        filter(some_var == input$Question) %>%
       group_by(some_grouping_var) %>%
        count()       
    
    # make value box
    valueBox(sum_values,"Response Count")
})

A few notes

The above code is not designed to run as is. This will need to be changed to align with your dataset. I would also take a look at the choices you are sending to selectInput. The current method is designed to send the column names (as that's what an earlier post suggested). In the last question, it seems you want to summarize data by groups. In that case the choices that are sent to selectInput should reflect the column in your dataset that contains the groups you want to select (e.g., updateSelectInput(...,choices = unique(mydata$mygroups),...)

The dplyr reference page may also be of use for you.

EDIT: hit post before I finished

Thanks a lot for your help.

I will work little more on summary statistics part and how to show in a separate page and get back to you.

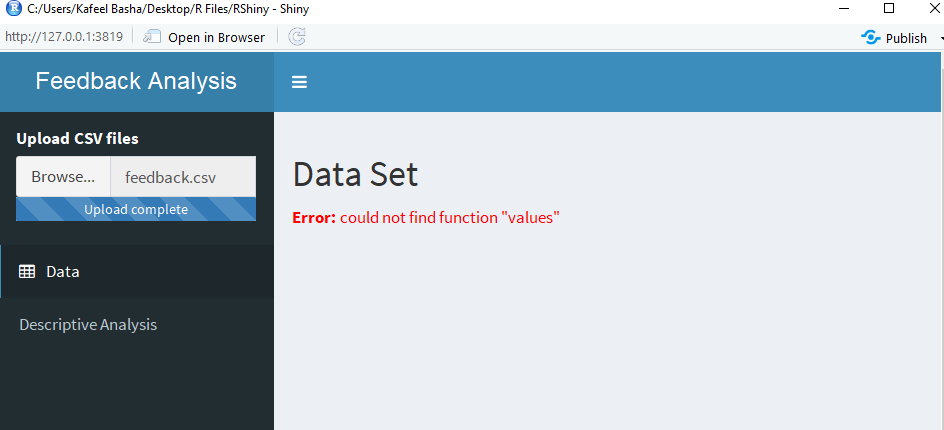
Also here as I am creating two tabs in dashboardBody(), one is to show the data set with tag "Data Set" which I am getting but the second tab "Feedback Analysis" is not visible here.

I am trying to show number of "Good" feedbacks and "Bad" feedbacks in the tab "Feedback Analysis".

I have found a way to create two separate tab panel to show data in one and another will be used to show the summary statistics. Working on this, will have to add more manipulation tasks, if any I will get back.

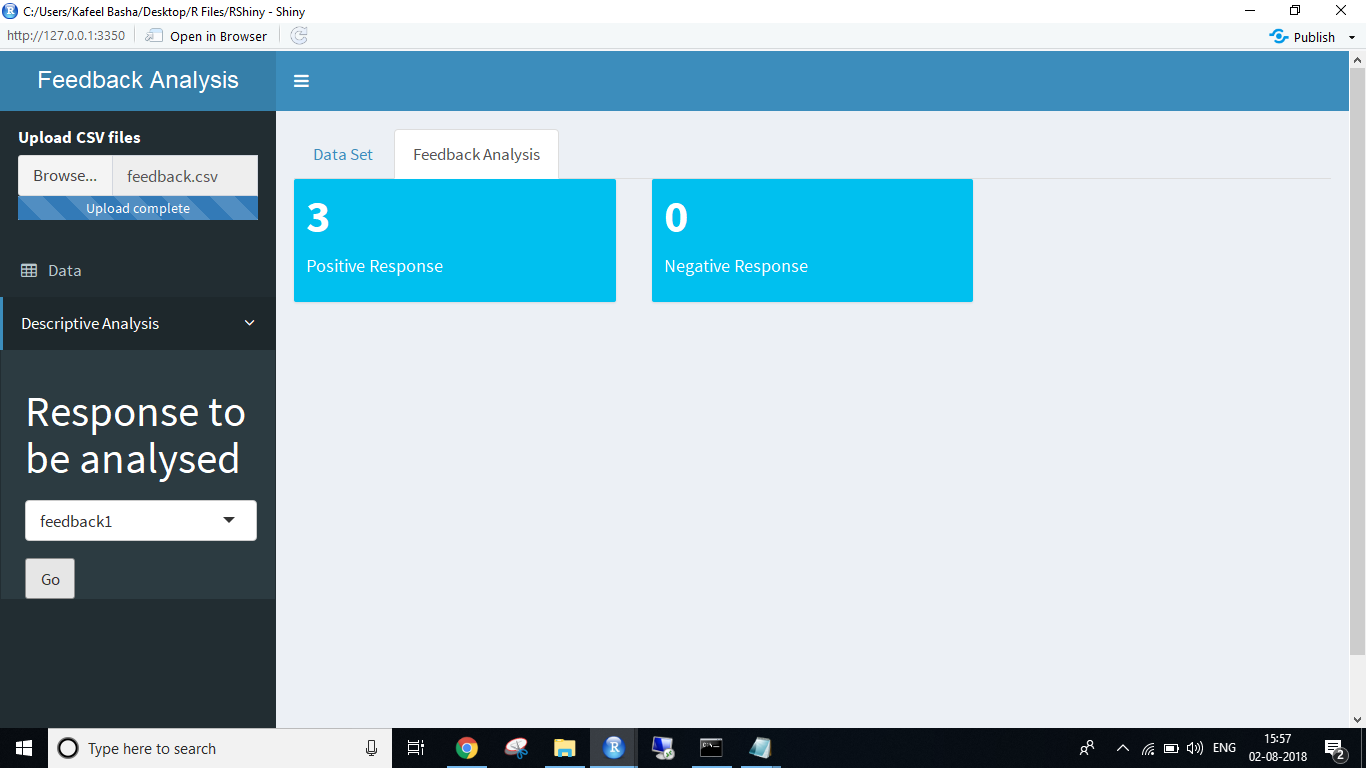
With all your help, I am able to perform text manipulation and get counts of GOOD and BAD response and arrange in a row. But when I change the variable name, I am not getting the desired answer.

The column 'feedback1" has 6 BAD and 60 GOOD, but I am getting counts as shown above. May I have trouble in rendering the right summary.

Please help me with this.

Codes are as below

library(shiny)
library(shinydashboard)

# ui
shinyUI(
  dashboardPage(
    
    # header
    dashboardHeader(title="Feedback Analysis"),
    
    # sidebar
    dashboardSidebar(
      fileInput("file","Upload CSV files",multiple=TRUE,accept=("text/comma")),
      
      # sidebar menu
      sidebarMenu(                  # option
                  menuItem(text = "Data", tabName="Data", icon=icon("table"), startExpanded = TRUE),
                  
                  # option
                  menuItem("Descriptive Analysis", tabName="Feedback Analysis",
                           
                           # input
                           selectInput(inputId = "Question",
                                       label = h1("Response to be analysed"),
                                       choices="",
                                       selected=""),
                           
                           # button
                           actionButton(inputId = "Go",label = "Go")
                  )
      ))
    ,
    
    # body
    dashboardBody(
      
        # tab 1: data
        tabItem(tabName="Data",
                tabsetPanel(id="Data",
                            tabPanel(
                "Data Set",tableOutput("data.frame")),
        
        
        tabPanel("Feedback Analysis",
          fluidRow(
            valueBoxOutput("pos"),
            valueBoxOutput("neg")
          )
        )
      )
  )
)
))

library(shinydashboard)
library(dplyr)
library(shiny)

server <- shinyServer(function(input,output,session){
  
  # read file
  values <- reactive({ read.csv(input$file$datapath) })
  
  
  # observeEvent for input$file
  observeEvent(input$file, {
    
    # render tables at file upload
    output$data.frame <- renderTable(values())
    
    # update selectInput#Question
    updateSelectInput(
      session, 
      inputId = "Question",
      choices=names(values()),    
      selected=names(values())[1]
    )
    
  })
  
  # observeEvent for input$Go
  observeEvent(input$Go, {
    # temp <- values([-input$Delete, ]    # commented for now
    # values <- temp                      # commented for now
    
    # commented for now
    library(tidyverse)
    library(tm)
    library(tokenizers)
    demo=Corpus(VectorSource(values()))
    demo=tm_map(demo,content_transformer(tolower))
    demo=tm_map(demo,removePunctuation)
    df<- data.frame(text=unlist(sapply(demo,`[`)),stringsAsFactors=F)
    df$text=ifelse(df$text=="poor"|df$text=="fair","BAD","GOOD")
    
    output$pos <- renderValueBox({
      
      # evaluate data: count, summarize, etc.
      positive<- df%>%
        filter(text=="GOOD") %>%count()       
      
      # make value box
      valueBox(positive,"Positive Response")
    })
    
    output$neg <- renderValueBox({
      
      # evaluate data: count, summarize, etc.
      negative<- df%>%
        filter(text=="BAD") %>%count()       
      
      # make value box
      valueBox(negative,"Negative Response")
    })
    
    
  })
  
})

Thanks for the extra info.

I think you can get away with performing these computations with base R rather than using tidyverse. For example:


# generate feedback in a similar format as the original post
 df <- data.frame(
     text = c(rep("GOOD",60),rep("BAD", 6)),
     stringsAsFactors = FALSE
 )


# summarize (these lines would be placed within the corresponding `renderValueBox({...})`
 good <- length(df$text[df$text == "GOOD"])    # good
 bad <- length(df$text[df$text == "BAD"])     # bad 
 
 
 # show output
 good
#> [1] 60
 bad
#> [1] 6

Created on 2018-08-03 by the reprex package (v0.2.0).

EDIT: After thinking about it some more, I’m wondering if there are conflicts with the tm and tokenizers packages. Some of the cleaning can be done using functions in the stringr/string package. (On mobile. Otherwise I would test this further.)

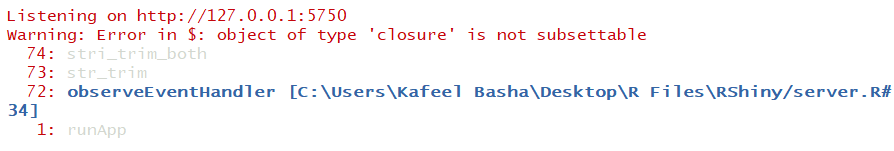
I was able to get the desired count if I run the codes line by line but not within shiny. I have considered your suggestion and use stringr package to manipulate the text and was getting below error.

Looks like I have a problem while rendering the output and the output doesn't change if I change the variable. Below is the codes used in server part using stringr.

library(shinydashboard)
library(dplyr)
library(shiny)

server <- shinyServer(function(input,output,session){
  
  # read file
  values <- reactive({ read.csv(input$file$datapath) })
  
  
  # observeEvent for input$file
  observeEvent(input$file, {
    
    # render tables at file upload
    output$data.frame <- renderTable(values())
    
    # update selectInput#Question
    updateSelectInput(
      session, 
      inputId = "Question",
      choices=names(values()),    
      selected=names(values())[1]
    )
    
  })
  
  # observeEvent for input$Go
  observeEvent(input$Go, {
    # temp <- values([-input$Delete, ]    # commented for now
    # values <- temp                      # commented for now
    
    # commented for now
    library(stringr)
    demo=str_trim(data$feedback1)
    demo=str_to_lower(demo)
    demo=str_replace_all(demo,"\n","")
    df<-data.frame(text=demo)
    df$text=ifelse(df$text=="poor"|df$text=="fair","BAD","GOOD")
    
    output$pos <- renderValueBox({
      
      # evaluate data: count, summarize, etc.
      positive<- df%>%
        filter(text=="GOOD") %>%count()       
      
      # make value box
      valueBox(positive,"Positive Response")
    })
    
    output$neg <- renderValueBox({
      
      # evaluate data: count, summarize, etc.
      negative<- df%>%
        filter(text=="BAD") %>%count()       
      
      # make value box
      valueBox(negative,"Negative Response")
    })
    
    
  })
  
})