Sort and then annotate bars by combinations of values of frequency they are created in R

Hi,
I would like to sort bars for example in descending order in ggplot and then annotate those bars by unique combinations of values they were created.

Here is my code nad what I have tried so far:

library(tidyverse)
library(plyr)
bazza <- structure(list(CHD = c(0, 0, 1, 0, 0, 0, 1, 0, 0, 0, 0, 0, 0, 
0, 0, 1, 0, 0, 0, 0), CAT = c(0, 0, 1, 1, 0, 0, 0, 0, 0, 0, 0, 
0, 0, 0, 0, 1, 0, 1, 0, 0), ECG = c(0, 0, 1, 0, 0, 0, 1, 0, 0, 
1, 0, 0, 0, 0, 0, 1, 0, 1, 0, 1)), class = c("tbl_df", "tbl", 
"data.frame"), row.names = c(NA, -20L))

bazza$CHD <- factor(bazza$CHD, levels = c(0, 1), labels = c("NO", "YES"))

bazza$CAT <- factor(bazza$CAT, levels = c(0, 1), labels = c("NO", "YES"))

bazza$ECG <- factor(bazza$ECG, levels = c(0, 1), labels = c("NO_Pra", "YES_Niepr"))


library(plyr)

bazza_freq <- ddply(bazza,.(CHD,CAT,ECG), nrow) |> arrange(desc(CHD), desc(CAT), desc(ECG))

bazza_freq$ID <- seq.int(nrow(bazza_freq))

bazza_freq$ID <- factor(bazza_freq$ID)

bazza_freq$V1<-factor(bazza_freq$V1,levels =
      bazza_freq$V1[order(bazza_freq$V1, decreasing = FALSE)]) # that one throws an error: 
#Error in `levels<-`(`*tmp*`, value = #as.character(levels)) :  factor level [2] is duplicated

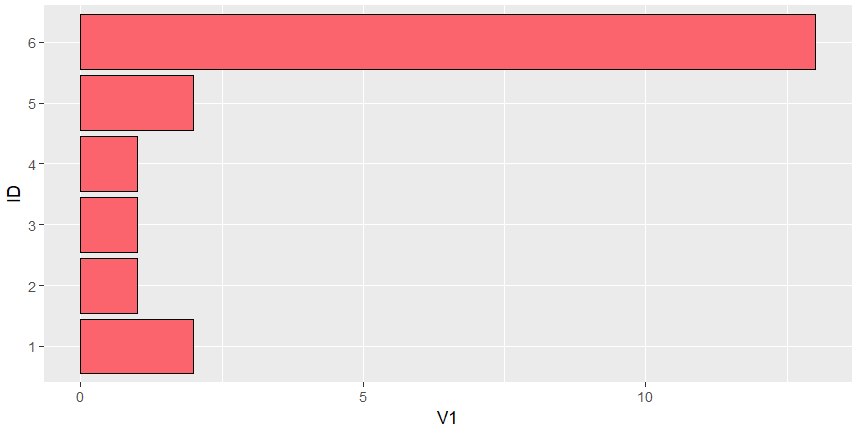
ggplot(bazza_freq, aes(x=ID, y=V1)) +
   geom_bar(stat="identity",fill = "#FF6666", colour="black") +
   scale_x_discrete(breaks = seq(1, 6, 1)) +
   coord_flip()

Which gives me this:

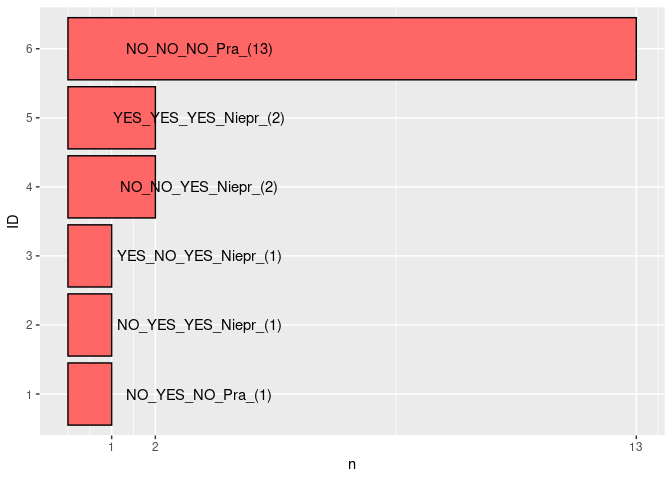
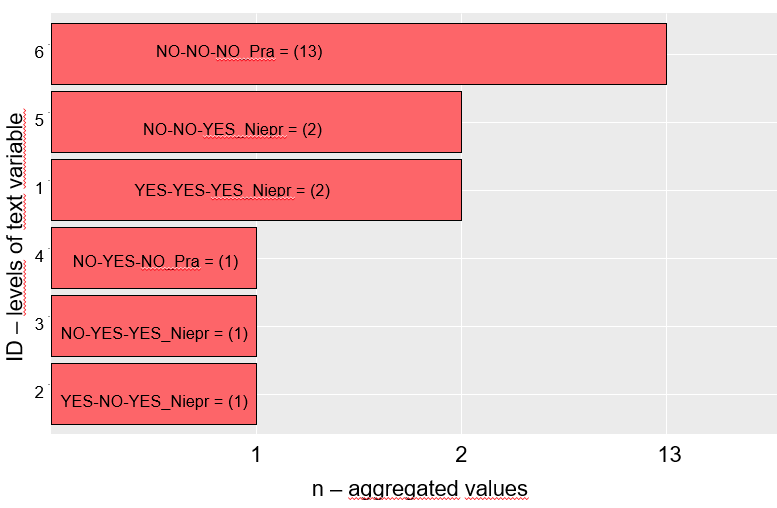
My desired output woud be with frequency values on Y-axis (horizontal after flipping) and with bars annotated in a nice way in order
to distinguish what bar is representing:

Any help would be greatly appreciated, thank you.

I think you are overcomplicating your code

library(tidyverse)

bazza <- data.frame(
         CHD = c(0, 0, 1, 0, 0, 0, 1, 0, 0, 0, 0, 0, 0, 0, 0, 1, 0, 0, 0, 0),
         CAT = c(0, 0, 1, 1, 0, 0, 0, 0, 0, 0, 0, 0, 0, 0, 0, 1, 0, 1, 0, 0),
         ECG = c(0, 0, 1, 0, 0, 0, 1, 0, 0, 1, 0, 0, 0, 0, 0, 1, 0, 1, 0, 1)
)

bazza_freq <- bazza %>%
    mutate(CHD = factor(CHD, levels = c(0, 1), labels = c("NO", "YES")),
           CAT = factor(CAT, levels = c(0, 1), labels = c("NO", "YES")),
           ECG = factor(ECG, levels = c(0, 1), labels = c("NO_Pra", "YES_Niepr"))) %>% 
    count(CHD, CAT, ECG) %>% 
    arrange(n) %>% 
    mutate(ID = factor(row_number()),
           text = paste0(CHD, "_", CAT, "_", ECG, "_", "(", n, ")")) 

bazza_freq %>% 
    ggplot(aes(x = n, y = ID)) +
    geom_col(fill = "#FF6666", colour="black") +
    geom_text(aes(label = text), x = 3) +
    scale_x_continuous(breaks = unique(bazza_freq$n))

Created on 2022-09-18 with reprex v2.0.2

2 Likes

Thank you Andres very much,

Is it possible to change the plot like this:

Is it possible to rescale horizontal axis so annotations are inside bars and inside bars they are center aligned ?

I suppose it's possible but I do not recommend treating a continuous scale as a categorical one, because the plot is visually deceiving.

This topic was automatically closed 42 days after the last reply. New replies are no longer allowed.

If you have a query related to it or one of the replies, start a new topic and refer back with a link.