Hi,
Here is my df:
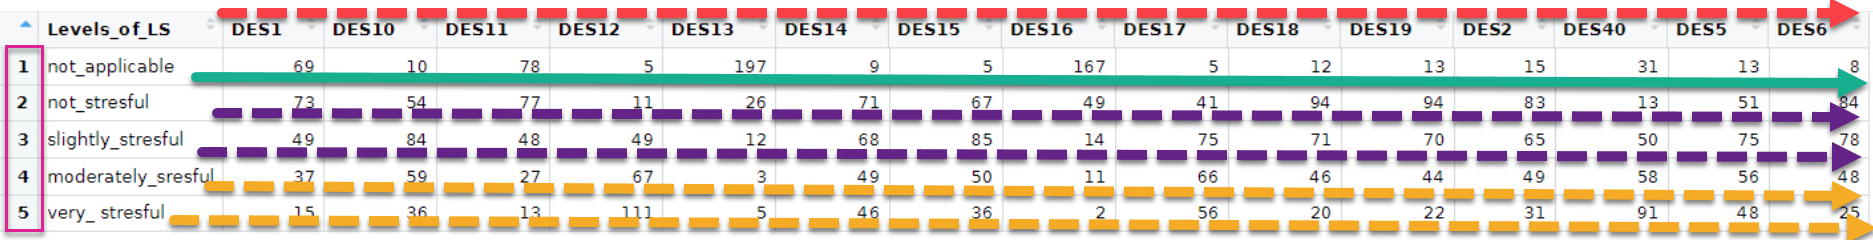
df <- structure(list(
  Levels_of_LS = c(
    "not_applicable", "not_stresful",
    "slightly_stresful", "moderately_sresful", "very_ stresful"
  ),
  DES1 = c(69, 73, 49, 37, 15), DES10 = c(10, 54, 84, 59, 36), DES11 = c(78, 77, 48, 27, 13), DES12 = c(
    5, 11, 49, 67,
    111
  ), DES13 = c(197, 26, 12, 3, 5), DES14 = c(
    9, 71, 68,
    49, 46
  ), DES15 = c(5, 67, 85, 50, 36), DES16 = c(
    167, 49,
    14, 11, 2
  ), DES17 = c(5, 41, 75, 66, 56), DES18 = c(
    12, 94,
    71, 46, 20
  ), DES19 = c(13, 94, 70, 44, 22), DES2 = c(
    15,
    83, 65, 49, 31
  ), DES40 = c(31, 13, 50, 58, 91), DES5 = c(
    13,
    51, 75, 56, 48
  ), DES6 = c(8, 84, 78, 48, 25)
), class = c(
  "tbl_df",
  "tbl", "data.frame"
), row.names = c(NA, -5L))
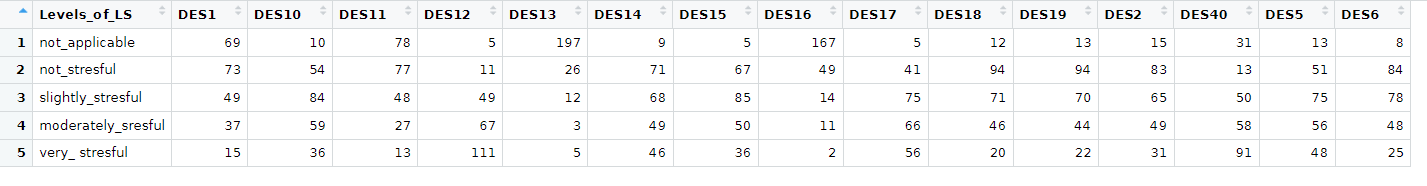
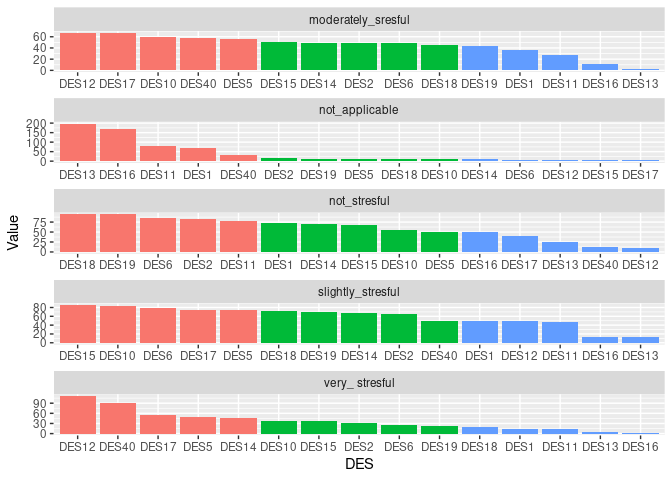
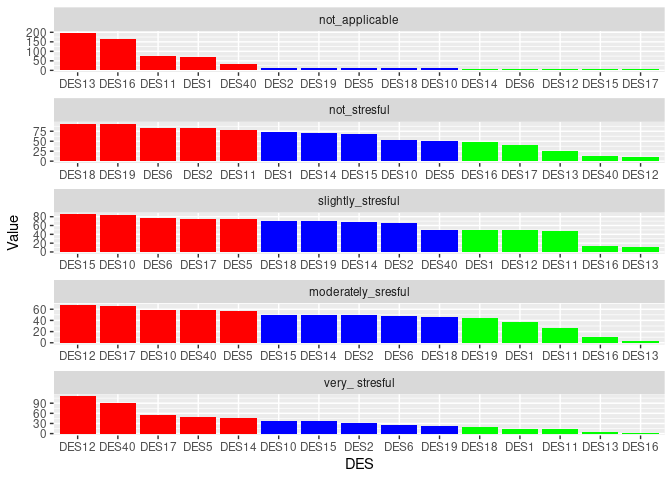
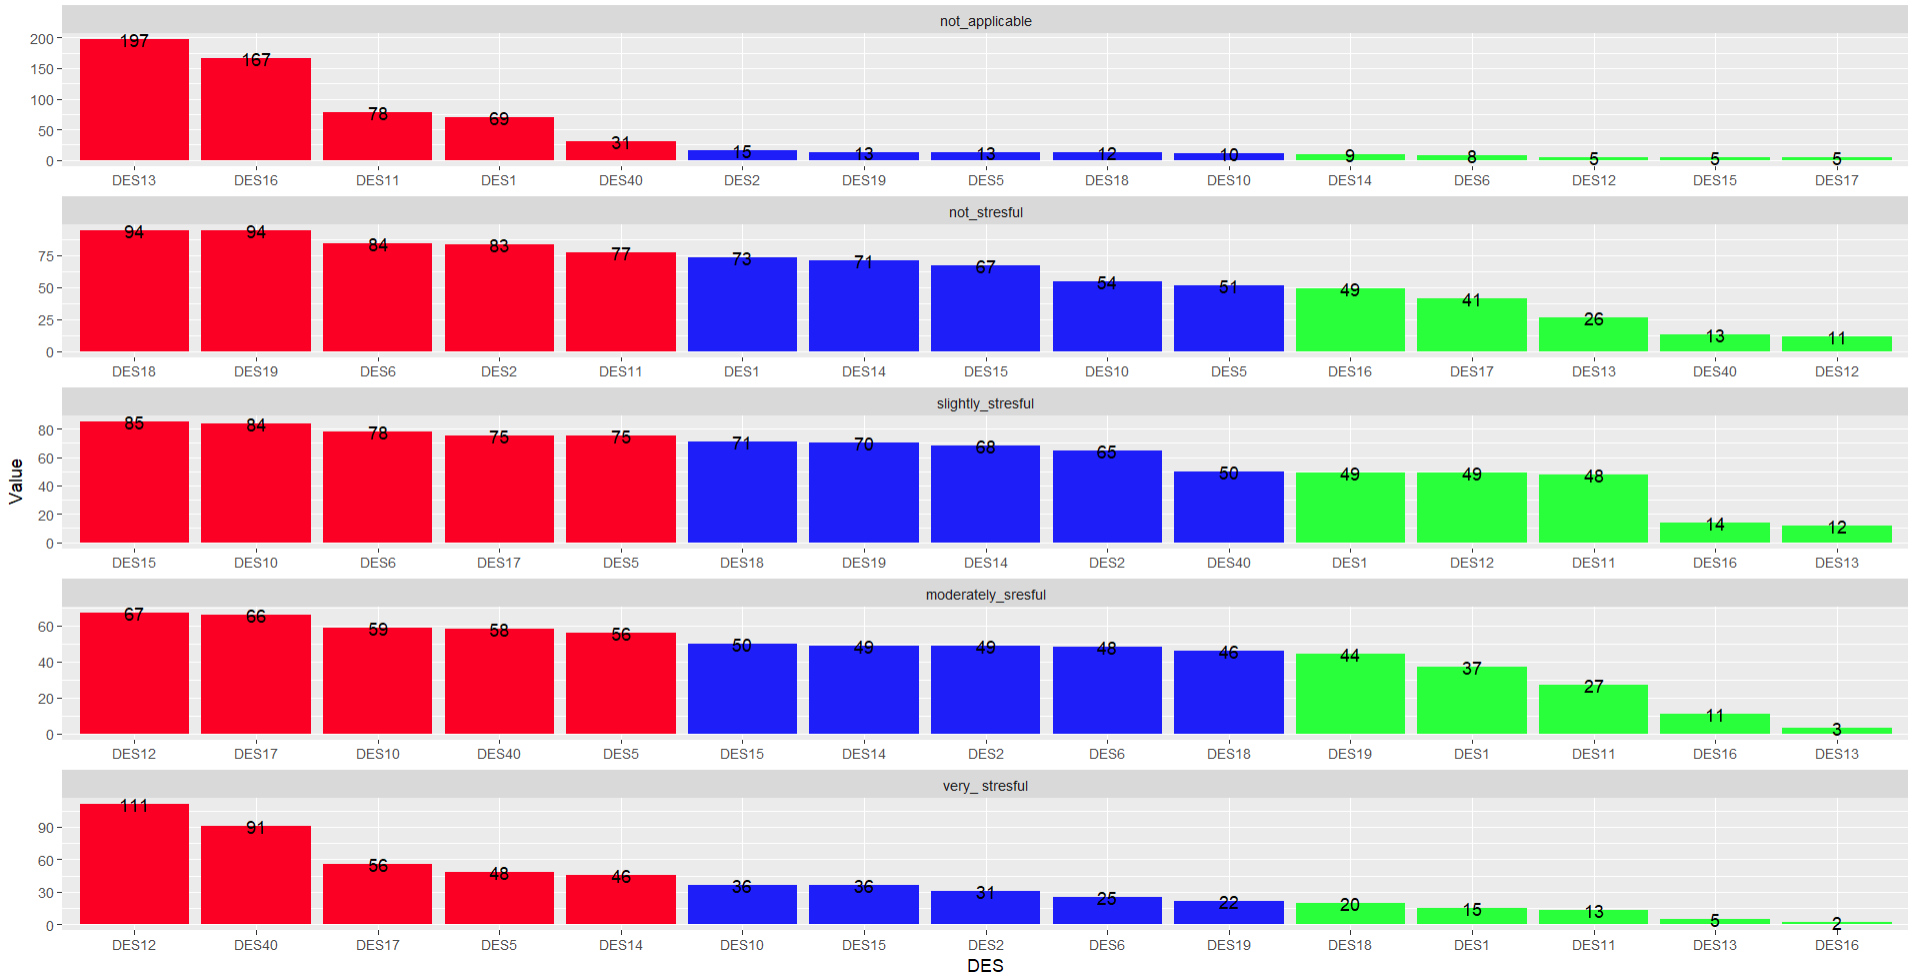
I would like to group_by I think by " Levels_of_LS" and sort this df(columns) in descending order according to DES values in particular rows contributing to eg. not_applicable, not_stresful and so on. Basically I would like to know which DES contributes the most(MAX) and the least(MIN) to each level of Levels_of_LS variable ? I would be grateful for any help regarding this matter. Later I would like to present those results on the plot.