With this data:
tibble::tribble(
        ~Part, ~PS, ~PD, ~AU, ~VO, ~PL,
         "PS", 71L, 15L,  8L,  1L, 25L,
         "PD",  2L, 65L,  5L,  2L, 25L,
         "AU", 20L,  12L, 80L,  3L, 45L,
         "VO",  7L,  8L,  7L, 94L,  5L
        )
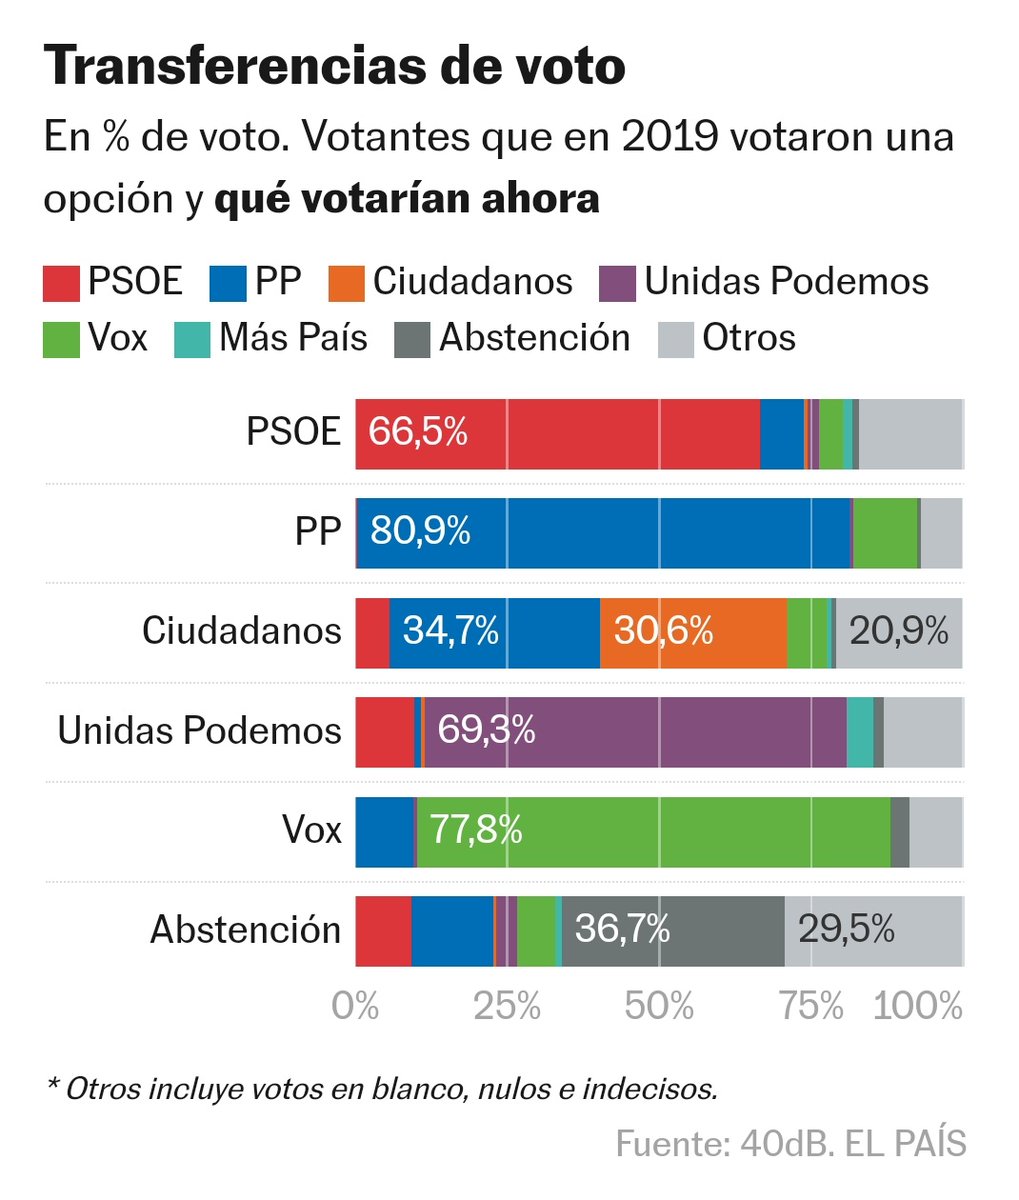
It's possible do this graph with ggplot2? Don't see the way...
Thanks in advance
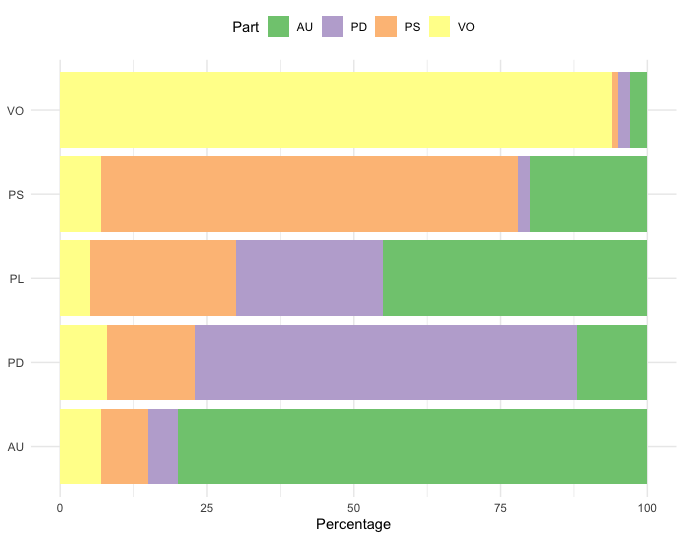
Here is an approximation of your plot. You might want to change fill colours and labels.
your_data |>
  pivot_longer(-Part) |>
  ggplot(aes(x = value, y = name, fill = Part)) +
  theme_minimal() +
  theme(legend.position = "top") +
  geom_col() +
  scale_fill_brewer(type = "qual") +
  labs(x = "Percentage", y = NULL)
system
Closed
3
This topic was automatically closed 7 days after the last reply. New replies are no longer allowed.
If you have a query related to it or one of the replies, start a new topic and refer back with a link.