I work in fisheries oceanography. For most of my career, we have used excel to calculate our station run times. Linearly this goes as follows:
We depart from port : arrive at the first station: sample: depart from first station: repeat
Knowing how much we can time-wise (sampling time and running to the next station) is vital for us to get a general idea of how much we can do over a given area.
I've been trying to recreate the spreadsheet we use in r, hopefully to create a Shiny app one day that will be much easier to use. Here's my issue:
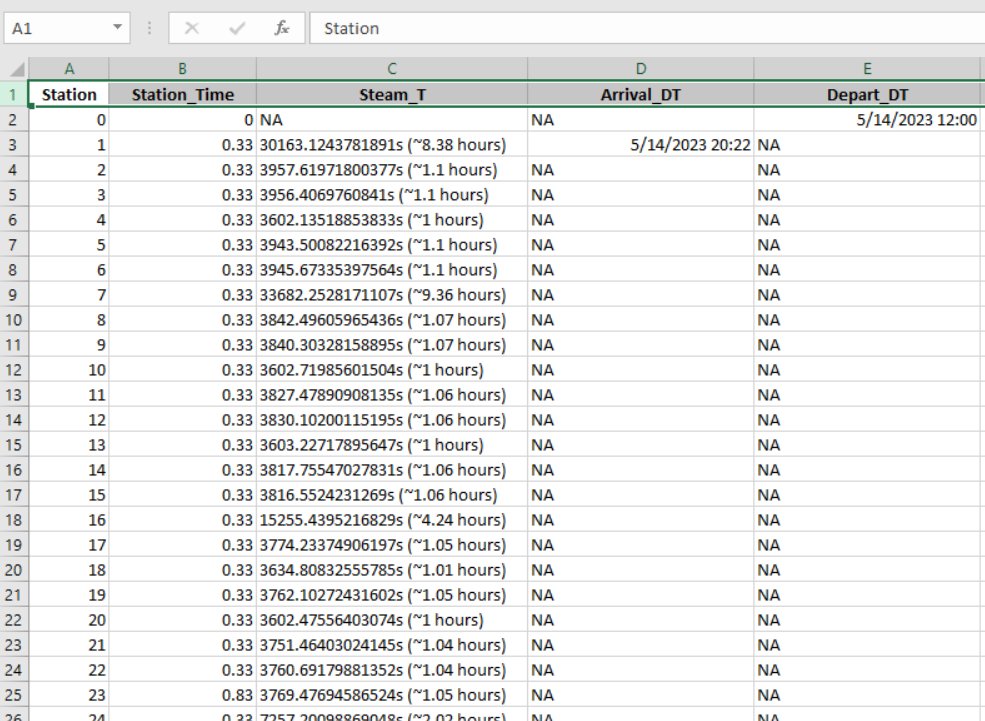
The uploaded image shows all the necessary columns of a larger data frame to calculate Departure and Arrival times.
Below is the code used to calculate both Departure and Arrival times. "Dp_Date" is a datetime variable used for your initial departure date (see in screeenshot). "Station == 0" is the port your departing from. I didn't include all of the Lat/Lon data, as it's not part of the question.
Where I'm stumped is how to calculate future Departure and Arrival times as they are based on previous calculations of each other. I think I could do this via purrr:accumulate or purrr::map_df, but I'm stumped. This shouldn't be this difficult.
It looks like an interesting problem but a screenshot of the data is no very useful. We really need some real data.
A handy way to supply some sample data is the dput() function. In the case of a large dataset something like dput(head(mydata, 100)) should supply the data we need. Just do dput(mydata) where mydata is your data. Copy the output and paste it here.
I think the logic of a solution is shown by the following example. I would leave the original departure at time zero, do the calculation, then add the appropriate date offset at the end. I used hours as the unit of time so I could use small integers and not hurt my brain.