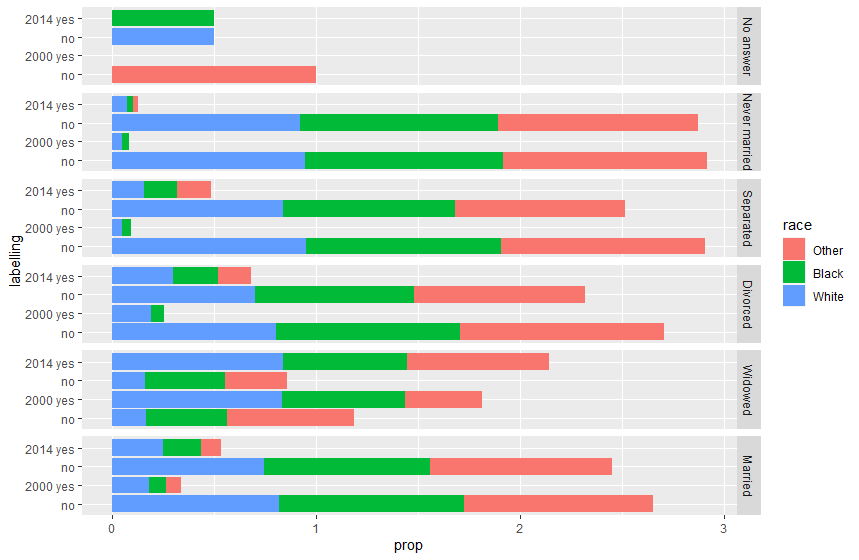
Whew, time flies! Unfortunately my first question has now closed due to inactivity, but I'm still struggling to get labels the way I would like. Here's the initial reprex:
library(tidyverse)
data("gss_cat")
gss_summarize <- gss_cat %>%
  mutate(retiree = if_else(age>62, "yes", "no")) %>%
  filter(year %in% c(2000, 2014)) %>%
  mutate(year = as_factor(year)) %>%
  group_by(year, marital, race, retiree) %>%
  summarize(n = n()) %>%
  mutate(prop = n/sum(n)) %>%
  mutate(labeling = paste(year, retiree)) %>%
  drop_na()
#> `summarise()` has grouped output by 'year', 'marital', 'race'. You can override
#> using the `.groups` argument.


ggplot(gss_summarize, aes(x=labeling, y=prop, fill = race)) +
  geom_col() +
  facet_grid(rows = vars(marital)) +
  coord_flip()
Created on 2022-08-23 by the reprex package (v2.0.1)
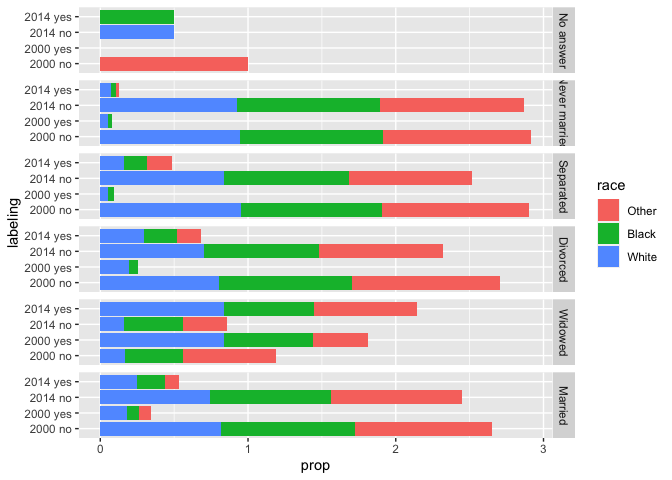
@martin.R had a nice idea to use ifelse to make the labels less repetitive, which works in theory but I can't get to work in practice. If I make those labels and use them as my x all the "no"s (for example) get collapsed together, because there's nothing to make them distinct in the variable.
library(tidyverse)
data("gss_cat")
gss_summarize <- gss_cat %>%
  mutate(retiree = if_else(age>62, "yes", "no")) %>%
  filter(year %in% c(2000, 2014)) %>%
  mutate(year = as_factor(year)) %>%
  group_by(year, marital, race, retiree) %>%
  summarize(n = n()) %>%
  mutate(prop = n/sum(n)) %>%
  mutate(group = paste(year, retiree)) %>%
  mutate(labeling = ifelse(retiree == "yes", group, retiree)) %>%
  drop_na()
#> `summarise()` has grouped output by 'year', 'marital', 'race'. You can override
#> using the `.groups` argument.


ggplot(gss_summarize, aes(x=labeling, y=prop, fill = race)) +
  geom_col() +
  facet_grid(rows = vars(marital)) +
  coord_flip()
Created on 2022-09-21 by the reprex package (v2.0.1)
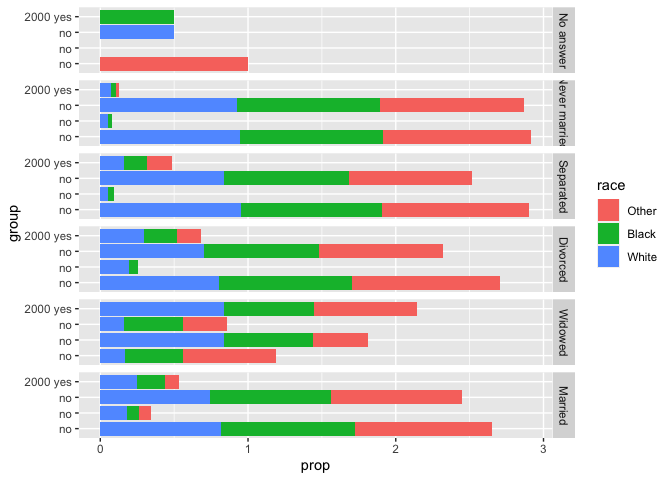
I thought I might be able to use the original group variable as my x, and then bring labeling in to re-label them, but I get an error.
library(tidyverse)
data("gss_cat")
gss_summarize <- gss_cat %>%
  mutate(retiree = if_else(age>62, "yes", "no")) %>%
  filter(year %in% c(2000, 2014)) %>%
  mutate(year = as_factor(year)) %>%
  group_by(year, marital, race, retiree) %>%
  summarize(n = n()) %>%
  mutate(prop = n/sum(n)) %>%
  mutate(group = paste(year, retiree)) %>%
  mutate(labeling = ifelse(retiree == "yes", group, retiree)) %>%
  drop_na()
#> `summarise()` has grouped output by 'year', 'marital', 'race'. You can override
#> using the `.groups` argument.


ggplot(gss_summarize, aes(x=group, y=prop, fill = race)) +
  geom_col() +
  facet_grid(rows = vars(marital)) +
  coord_flip() +
  scale_x_discrete(labels = labeling)
#> Error in check_breaks_labels(breaks, labels): object 'labeling' not found
Created on 2022-09-21 by the reprex package (v2.0.1)
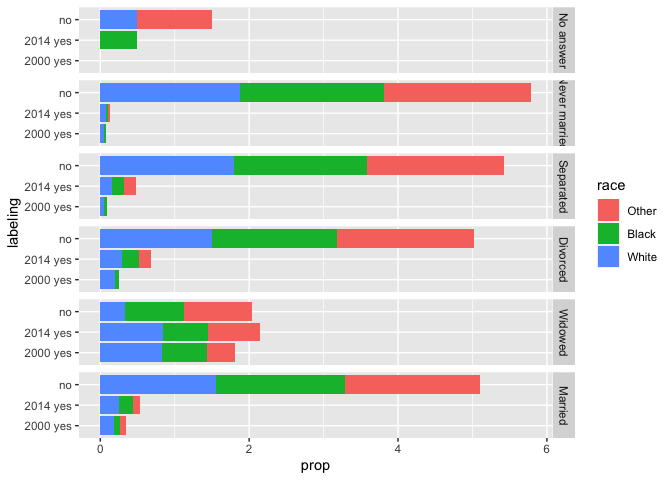
I suspect this is because labeling isn't in my aes() at the beginning, so maybe is not accessible to ggplot? I tried writing a little function as well, and got a similar error. Passing in the vector doesn't give an error, but clearly isn't the right result,
library(tidyverse)
data("gss_cat")
gss_summarize <- gss_cat %>%
  mutate(retiree = if_else(age>62, "yes", "no")) %>%
  filter(year %in% c(2000, 2014)) %>%
  mutate(year = as_factor(year)) %>%
  group_by(year, marital, race, retiree) %>%
  summarize(n = n()) %>%
  mutate(prop = n/sum(n)) %>%
  mutate(group = paste(year, retiree)) %>%
  mutate(labeling = ifelse(retiree == "yes", group, retiree)) %>%
  drop_na()
#> `summarise()` has grouped output by 'year', 'marital', 'race'. You can override
#> using the `.groups` argument.


ggplot(gss_summarize, aes(x=group, y=prop, fill = race)) +
  geom_col() +
  facet_grid(rows = vars(marital)) +
  coord_flip() +
  scale_x_discrete(labels = gss_summarize$labeling)
Created on 2022-09-21 by the reprex package (v2.0.1)
I suspect this idea is a bit out of scope for ggplot2, but I'd appreciate any other ideas on how to make it work!