Hello everybody,
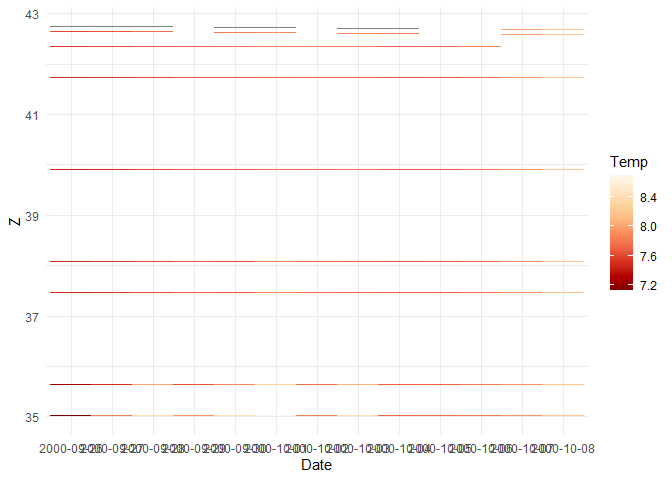
I am trying to recreate a plot similar to this which illustrates temperature variation with depth over time.

The outputs from my code did not look right. Can anyone help me? Thanks!
library(RColorBrewer)
library(dplyr)
library(ggplot2)
DF <- data.frame(
Date = c("2000-09-26","2000-09-26","2000-09-26","2000-09-26",
"2000-09-26","2000-09-26","2000-09-26",
"2000-09-26","2000-09-26","2000-09-26",
"2000-09-26","2000-09-26","2000-09-26",
"2000-09-26","2000-09-26","2000-09-27","2000-09-27",
"2000-09-27","2000-09-27","2000-09-27",
"2000-09-27","2000-09-27","2000-09-27",
"2000-09-27","2000-09-27","2000-09-27","2000-09-27",
"2000-09-27","2000-09-27","2000-09-27",
"2000-09-28","2000-09-28","2000-09-28",
"2000-09-28","2000-09-28","2000-09-28",
"2000-09-28","2000-09-28","2000-09-28","2000-09-28",
"2000-09-28","2000-09-28","2000-09-28",
"2000-09-28","2000-09-28","2000-09-29",
"2000-09-29","2000-09-29","2000-09-29","2000-09-29",
"2000-09-29","2000-09-29","2000-09-29",
"2000-09-29","2000-09-29","2000-09-29",
"2000-09-29","2000-09-29","2000-09-29",
"2000-09-29","2000-09-30","2000-09-30","2000-09-30",
"2000-09-30","2000-09-30","2000-09-30",
"2000-09-30","2000-09-30","2000-09-30",
"2000-09-30","2000-09-30","2000-09-30","2000-09-30",
"2000-09-30","2000-09-30","2000-10-01",
"2000-10-01","2000-10-01","2000-10-01",
"2000-10-01","2000-10-01","2000-10-01",
"2000-10-01","2000-10-01","2000-10-01","2000-10-01",
"2000-10-01","2000-10-01","2000-10-01",
"2000-10-01","2000-10-02","2000-10-02",
"2000-10-02","2000-10-02","2000-10-02","2000-10-02",
"2000-10-02","2000-10-02","2000-10-02",
"2000-10-02","2000-10-02","2000-10-02",
"2000-10-02","2000-10-02","2000-10-02",
"2000-10-03","2000-10-03","2000-10-03","2000-10-03",
"2000-10-03","2000-10-03","2000-10-03",
"2000-10-03","2000-10-03","2000-10-03",
"2000-10-03","2000-10-03","2000-10-03","2000-10-03",
"2000-10-03","2000-10-04","2000-10-04",
"2000-10-04","2000-10-04","2000-10-04",
"2000-10-04","2000-10-04","2000-10-04",
"2000-10-04","2000-10-04","2000-10-04","2000-10-04",
"2000-10-04","2000-10-04","2000-10-04",
"2000-10-05","2000-10-05","2000-10-05",
"2000-10-05","2000-10-05","2000-10-05","2000-10-05",
"2000-10-05","2000-10-05","2000-10-05",
"2000-10-05","2000-10-05","2000-10-05",
"2000-10-05","2000-10-05","2000-10-06",
"2000-10-06","2000-10-06","2000-10-06","2000-10-06",
"2000-10-06","2000-10-06","2000-10-06",
"2000-10-06","2000-10-06","2000-10-06",
"2000-10-06","2000-10-06","2000-10-06","2000-10-06",
"2000-10-07","2000-10-07","2000-10-07",
"2000-10-07","2000-10-07","2000-10-07",
"2000-10-07","2000-10-07","2000-10-07",
"2000-10-07","2000-10-07","2000-10-07","2000-10-07",
"2000-10-07","2000-10-08","2000-10-08",
"2000-10-08","2000-10-08","2000-10-08",
"2000-10-08","2000-10-08","2000-10-08","2000-10-08",
"2000-10-08","2000-10-08","2000-10-08",
"2000-10-08","2000-10-08"),
Z = c(42.74,
42.64,42.34,41.73,41.12,40.51,39.9,39.29,
38.68,38.07,37.46,36.85,36.24,35.63,
35.02,42.74,42.64,42.34,41.73,41.12,40.51,
39.9,39.29,38.68,38.07,37.46,36.85,36.24,
35.63,35.02,42.74,42.64,42.34,41.73,
41.12,40.51,39.9,39.29,38.68,38.07,37.46,
36.85,36.24,35.63,35.02,42.73,42.63,42.34,
41.73,41.12,40.51,39.9,39.29,38.68,
38.07,37.46,36.85,36.24,35.63,35.02,42.72,
42.62,42.34,41.73,41.12,40.51,39.9,39.29,
38.68,38.07,37.46,36.85,36.24,35.63,
35.02,42.72,42.62,42.34,41.73,41.12,40.51,
39.9,39.29,38.68,38.07,37.46,36.85,
36.24,35.63,35.02,42.71,42.61,42.34,41.73,
41.12,40.51,39.9,39.29,38.68,38.07,37.46,
36.85,36.24,35.63,35.02,42.7,42.6,42.34,
41.73,41.12,40.51,39.9,39.29,38.68,
38.07,37.46,36.85,36.24,35.63,35.02,42.7,
42.6,42.34,41.73,41.12,40.51,39.9,39.29,
38.68,38.07,37.46,36.85,36.24,35.63,
35.02,42.69,42.59,42.34,41.73,41.12,40.51,
39.9,39.29,38.68,38.07,37.46,36.85,36.24,
35.63,35.02,42.69,42.59,42.34,41.73,
41.12,40.51,39.9,39.29,38.68,38.07,37.46,
36.85,36.24,35.63,35.02,42.68,42.58,41.73,
41.12,40.51,39.9,39.29,38.68,38.07,
37.46,36.85,36.24,35.63,35.02,42.68,42.58,
41.73,41.12,40.51,39.9,39.29,38.68,38.07,
37.46,36.85,36.24,35.63,35.02),
Temp = c(NA,7.6,
7.56,7.51,7.49,7.48,7.48,7.48,7.48,7.48,
7.48,7.5,7.52,7.25,7.13,NA,7.65,7.61,
7.56,7.55,7.55,7.54,7.54,7.55,7.55,
7.55,7.55,7.55,7.52,7.84,NA,7.76,7.68,7.6,
7.59,7.59,7.59,7.59,7.59,7.6,7.61,
7.66,7.77,8.01,8.4,NA,7.76,7.73,7.69,7.68,
7.68,7.69,7.69,7.69,7.69,7.68,7.67,
7.67,7.64,7.93,NA,7.82,7.77,7.72,7.7,7.7,
7.7,7.7,7.7,7.62,7.65,7.68,7.73,7.88,
8.44,NA,7.89,7.8,7.76,7.76,7.76,7.76,
7.77,7.81,7.87,7.9,7.9,7.98,8.3,8.69,
NA,7.87,7.83,7.78,7.74,7.74,7.74,7.75,
7.76,7.76,7.76,7.76,7.76,7.75,7.84,NA,
7.9,7.83,7.78,7.78,7.78,7.78,7.78,7.77,
7.75,7.72,7.72,7.85,8.07,8.43,NA,7.8,
7.73,7.68,7.68,7.67,7.67,7.67,7.67,7.67,
7.67,7.67,7.68,7.69,7.73,NA,7.81,7.74,
7.69,7.69,7.69,7.69,7.69,7.69,7.69,
7.69,7.69,7.69,7.7,7.75,7.96,7.95,7.86,7.79,
7.79,7.78,7.78,7.78,7.78,7.78,7.78,
7.78,7.79,7.8,7.8,8.00,7.99,7.95,7.93,7.93,
7.93,7.93,7.92,7.92,7.92,7.92,7.92,
7.92,7.95,8.23,8.23,8.21,8.19,8.18,8.17,
8.17,8.17,8.17,8.16,8.16,8.16,8.17,8.2)
)
DF
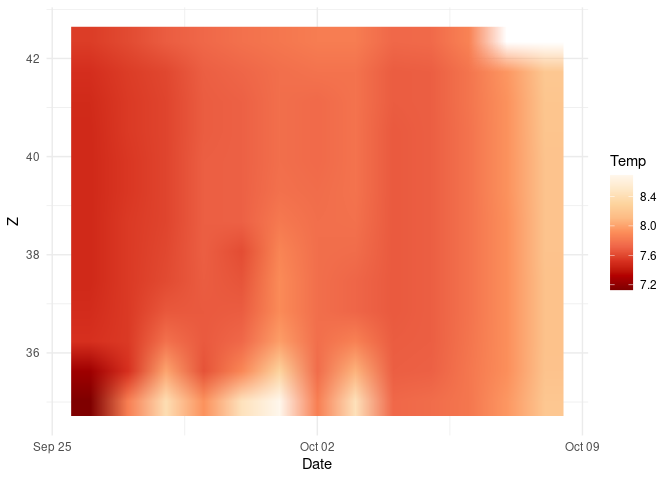
contour_plot <- ggplot(DF, aes(Date, Z)) +
geom_raster(aes(fill = Temp), interpolate = TRUE) +
scale_fill_gradientn(colours = rev(brewer.pal(9, 'OrRd'))) +
theme_minimal()
contour_plot
#> Warning: Raster pixels are placed at uneven vertical intervals and will be
#> shifted. Consider using geom_tile() instead.
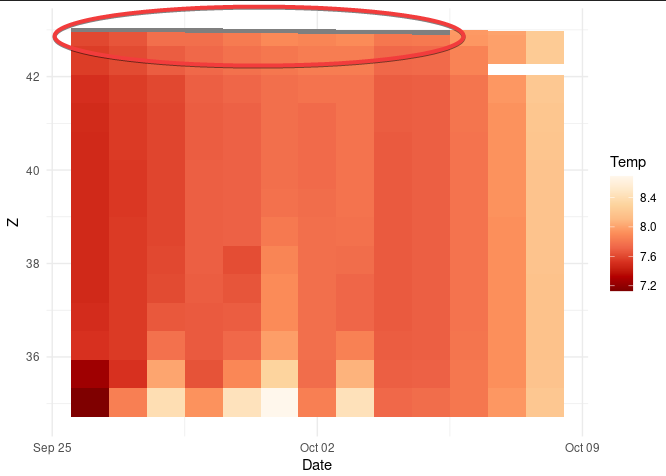
contour_plot_tile <- ggplot(DF, aes(Date, Z)) +
  geom_tile(aes(fill = Temp)) +
  scale_fill_gradientn(colours = rev(brewer.pal(9, 'OrRd'))) +
  theme_minimal()
contour_plot_tile