Styling advice on layout for tables and graphs, which package is the best?

Hi,

You are almost there. Have you read reprex website for help. There also explanation about reproductible example in those further reading

In short:

  1. Call dput outside of the reprex on your data. Call it before creating the reprex code, in an environment where your object is known. Then you'll have a structure result that define your object.
  2. Copy paste it in the reprex and assign it to a value, here gss.
gss <- structure(...)
  1. Then use this gss object that the reprex code / session will now know.
gss %>% 
filter(year %in% c("1982", "2012"))

Is this clear? (I am in my phone, can't provide sample code. But @nick explains it. With his suggestion your reprex should contain a call a structure .)

1 Like

Thank you Christophe for your patience. When I consulted the reprex website it was not clear to me how I should recreate a dataframe. Thank you for walking me through it with much more easy explanations!
I am only getting the years 1982 but I could figure that out later with a sampling function.
Is this a successful reprex?

reprex::reprex_info()
#> Warning in as.POSIXlt.POSIXct(Sys.time()): unknown timezone 'default/
#> Europe/Paris'
#> Created by the reprex package v0.1.1.9000 on 2017-11-22

library(ggplot2)
library(dplyr)
#> Warning: package 'dplyr' was built under R version 3.4.2
#> 
#> Attaching package: 'dplyr'
#> The following objects are masked from 'package:stats':
#> 
#>     filter, lag
#> The following objects are masked from 'package:base':
#> 
#>     intersect, setdiff, setequal, union
library(statsr)
library (tidyverse)
#> Loading tidyverse: tibble
#> Loading tidyverse: tidyr
#> Loading tidyverse: readr
#> Loading tidyverse: purrr
#> Conflicts with tidy packages ----------------------------------------------
#> filter(): dplyr, stats
#> lag():    dplyr, stats
library (reprex)
library(knitr)
library(kableExtra)

gss_example<-structure(list(type = c("Other", "Other", "Other", "Other", NA, 
"Other", "Very Satisfied", NA, "Very Satisfied", NA, "Other", 
"Very Satisfied", "Other", "Other", "Very Satisfied", "Other", 
"Other", "Very Satisfied", "Other", NA, "Other", "Very Satisfied", 
"Very Satisfied", "Other", "Very Satisfied"), year = c(1982L, 
1982L, 1982L, 1982L, 1982L, 1982L, 1982L, 1982L, 1982L, 1982L, 
1982L, 1982L)), .Names = c("type", "year"), row.names = c(NA, 
30L), class = "data.frame")


gss_example %>% 
count(year, type) %>%
group_by(year) %>%
mutate(prop = n / sum(n)) %>%
select(-n) %>%
spread(key = type, value = prop) %>% 
arrange(desc(year)) %>% 
kable("html") %>%
kable_styling()
```{r}
gss_example <- gss %>% 
filter(gss$year %in% c("1982", "2012")) %>% 
mutate(type = ifelse(satjob =="Very Satisfied","Very Satisfied", "Other")) %>% 
select(type,year)
dput(head(gss_example, 30))
gss_example<-structure(list(type = c("Other", "Other", "Other", "Other", NA, 
"Other", "Very Satisfied", NA, "Very Satisfied", NA, "Other", 
"Very Satisfied", "Other", "Other", "Very Satisfied", "Other", 
"Other", "Very Satisfied", "Other", NA, "Other", "Very Satisfied", 
"Very Satisfied", "Other", "Very Satisfied"), year = c(1982L, 
1982L, 1982L, 1982L, 1982L, 1982L, 1982L, 1982L, 1982L, 1982L, 
1982L, 1982L)), .Names = c("type", "year"), row.names = c(NA, 
30L), class = "data.frame")

Hi Christine,

The above example is a bit hard to follow at first glance. At first, everything looks OK with the gss_example code, but when you start to use the gss dataframe in the second snippet (shown below), we do not have code to recreate that object, which makes it hard to reproduce your steps for these steps:

It looks like you are simply creating a subset of your main data (from the gss dataframe) you wish to share with 30 rows, correct? Depending on how large the dataset is, it might be better to either use the whole gss dataframe, or simply leave out the code above. From the helper's perspective, we don't really need the line:

Really, the community (as the 'helper') are here to help guide you (and hopefully help you) solve or better understand the issue you are facing. From that perspective, if you think we need only 30 rows of data to help solve your problem, include 30 rows. If you think we need 100 rows, I would say include the 100 rows, but try to keep it minimal to show the issue you want to solve. Personally, I'd rather you include the whole dataset so that I can fully recreate the problem, so that I can help you solve your issue, but others would disagree with this view. It's not necessary to have the above line in the reprex, as we (as the helper) don't really need to recreate the dataframe. If you do go this route, you will want to keep that to know how you re-created a subset of your data (for housekeeping), but it is not necessary in the reprex. Does that make sense?

As @mara noted, datapasta::tribble_paste(<your_df>) will give you a nice output to recreate a tibble, which can be easier to read than simply dput in base-r. I do coincide with you in that I think the reprex readme page could be a bit more friendly, as I still feel somewhat lost on the readme page of the repo. I find myself writing out a 6 six step process every time I need to create a reprex, because I can't find a simple procedure that outlines the core steps.

Regarding your original question, are you intending to output to Word Excel, or simply a HTML file? If you are knitting to Excel, Word, etc.., I would suggest looking into the officer package, as they have done a fantastic job of allowing for much needed functionality in basic reporting:

https://davidgohel.github.io/officer/articles/offcran/tables.html

3 Likes

@pgensler already give you some answers about why you only getting 1982 rows. If you want 30 rows but not in a row, use a sample when calling dput.

About the reprex process: Almost there!! :wink: :blush:
I could use part of your code to produce a reprex. Here what it should have been

reprex::reprex_info()
#> Created by the reprex package v0.1.1.9000 on 2017-11-22

library(tidyverse)
library(knitr)
library(kableExtra)

gss_example<-structure(list(type = c("Other", "Other", "Other", "Other", NA, 
                                     "Other", "Very Satisfied", NA, "Very Satisfied", NA, "Other", 
                                     "Very Satisfied", "Other", "Other", "Very Satisfied", "Other", 
                                     "Very Satisfied", "Other", "Other", "Very Satisfied", "Other", 
                                     "Other", "Very Satisfied", "Other", NA, "Other", "Very Satisfied", 
                                     "Very Satisfied", "Other", "Very Satisfied"), year = c(1982L, 
                                                                                            1982L, 1982L, 1982L, 1982L, 1982L, 1982L, 1982L, 1982L, 1982L, 
                                                                                            1982L, 1982L, 1982L, 1982L, 1982L, 1982L, 1982L, 1982L, 1982L, 
                                                                                            1982L, 1982L, 1982L, 1982L, 1982L, 1982L, 1982L, 1982L, 1982L, 
                                                                                            1982L, 1982L)), .Names = c("type", "year"), row.names = c(NA, 
                                                                                                                                                      30L), class = "data.frame")


gss_example %>% 
  count(year, type) %>%
  group_by(year) %>%
  mutate(prop = n / sum(n)) %>%
  select(-n) %>%
  spread(key = type, value = prop) %>% 
  arrange(desc(year)) %>% 
  kable("html") %>%
  kable_styling()

year

Other

Very Satisfied

<NA>

1982

0.5333333

0.3333333

0.1333333


Some advice on the process:

  • You used dput to produce sample of data -> One solution for first Ok.
  • Just load the :package: you need for the example. You see I only load a few and it works.
  • You don't need to load reprex in the example. It is only for use on your side for creating the reprex
  • When your code is ok in your session. Copy it, then in your console, call reprex::reprex(). The result will be in the clipboard. You can paste directly in the post here.

This don't help with your original question but I hope you will understand more closely how to provide this community with nice reproducible example ! :smile:

3 Likes

Hello again,

Pardon long reply. Thank you for that "should have been" result @cderv and advice on what you need as helper @pgensler !!!!
I hope to be able to produce easy and nice to read reprex @nick with all the help I have been receiving from everyone and @mara! I played around with the different suggestions and hope they are right even thought my original question has been answered.

reprex::reprex_info()
#> Warning in as.POSIXlt.POSIXct(Sys.time()): unknown timezone 'default/
#> Europe/Paris'
#> Created by the reprex package v0.1.1.9000 on 2017-11-26

library (tidyverse)
#> Loading tidyverse: ggplot2
#> Loading tidyverse: tibble
#> Loading tidyverse: tidyr
#> Loading tidyverse: readr
#> Loading tidyverse: purrr
#> Loading tidyverse: dplyr
#> Warning: package 'dplyr' was built under R version 3.4.2
#> Conflicts with tidy packages ----------------------------------------------
#> filter(): dplyr, stats
#> lag():    dplyr, stats
library(knitr)
library(kableExtra)

data.frame(tribble(
                                                   ~type, ~year,
                                        "Very Satisfied", 1982L,
                                                      NA, 2012L,
                                        "Very Satisfied", 1982L,
                                        "Very Satisfied", 1982L,
                                        "Very Satisfied", 1982L,
                                        "Very Satisfied", 2012L,
                                                 "Other", 2012L,
                                                 "Other", 2012L,
                                                 "Other", 1982L,
                                                      NA, 1982L,
                                        "Very Satisfied", 2012L,
                                                      NA, 2012L,
                                        "Very Satisfied", 1982L,
                                                      NA, 1982L,
                                        "Very Satisfied", 1982L,
                                                      NA, 1982L,
                                                 "Other", 2012L,
                                        "Very Satisfied", 2012L,
                                                      NA, 1982L,
                                                 "Other", 2012L,
                                        "Very Satisfied", 2012L,
                                        "Very Satisfied", 1982L,
                                        "Very Satisfied", 1982L,
                                        "Very Satisfied", 2012L,
                                        "Very Satisfied", 2012L,
                                        "Very Satisfied", 2012L,
                                                 "Other", 2012L,
                                                 "Other", 1982L,
                                                      NA, 2012L,
                                        "Very Satisfied", 2012L,
                                                      NA, 1982L,
                                                      NA, 2012L,
                                        "Very Satisfied", 2012L,
                                                 "Other", 1982L,
                                                 "Other", 1982L,
                                                      NA, 1982L,
                                                 "Other", 1982L,
                                                 "Other", 2012L,
                                        "Very Satisfied", 1982L,
                                        "Very Satisfied", 2012L,
                                        "Very Satisfied", 2012L,
                                        "Very Satisfied", 2012L,
                                                 "Other", 2012L,
                                        "Very Satisfied", 2012L,
                                                      NA, 2012L,
                                                 "Other", 1982L,
                                        "Very Satisfied", 2012L,
                                        "Very Satisfied", 1982L,
                                                 "Other", 2012L,
                                                 "Other", 1982L
                                       )) %>% 
count(year, type) %>%
group_by(year) %>%
mutate(prop = n / sum(n)) %>%
select(-n) %>%
spread(key = type, value = prop) %>% 
arrange(desc(year)) %>% 
kable("html") %>%
kable_styling()

year

Other

Very Satisfied

<NA>

2012

0.2962963

0.5185185

0.1851852

1982

0.3043478

0.4347826

0.2608696

```
reprex::reprex_info()
#> Warning in as.POSIXlt.POSIXct(Sys.time()): unknown timezone 'default/
#> Europe/Paris'
#> Created by the reprex package v0.1.1.9000 on 2017-11-26

library (tidyverse)
#> Loading tidyverse: ggplot2
#> Loading tidyverse: tibble
#> Loading tidyverse: tidyr
#> Loading tidyverse: readr
#> Loading tidyverse: purrr
#> Loading tidyverse: dplyr
#> Warning: package 'dplyr' was built under R version 3.4.2
#> Conflicts with tidy packages ----------------------------------------------
#> filter(): dplyr, stats
#> lag():    dplyr, stats
library(knitr)
library(kableExtra)


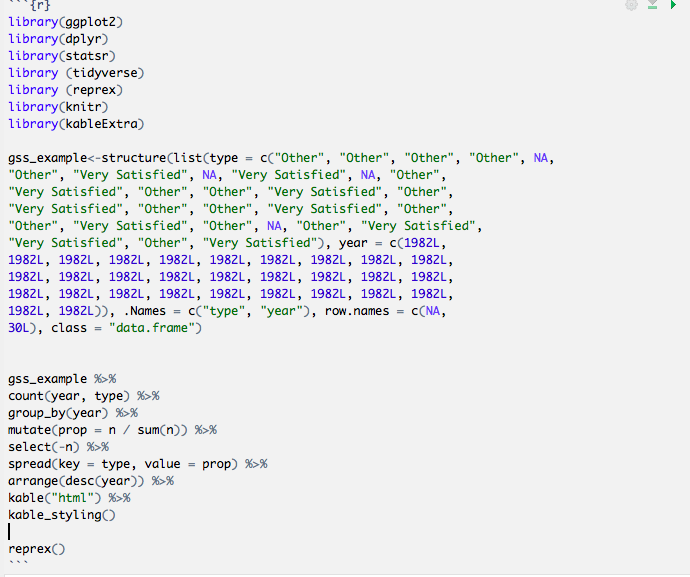
gss_example<-structure(list(type = c("Very Satisfied", NA, "Very Satisfied", 
"Very Satisfied", "Very Satisfied", "Very Satisfied", "Other", 
"Other", "Other", NA, "Very Satisfied", NA, "Very Satisfied", 
NA, "Very Satisfied", NA, "Other", "Very Satisfied", NA, "Other", 
"Very Satisfied", "Very Satisfied", "Very Satisfied", "Very Satisfied", 
"Very Satisfied", "Very Satisfied", "Other", "Other", NA, "Very Satisfied", 
NA, NA, "Very Satisfied", "Other", "Other", NA, "Other", "Other", 
"Very Satisfied", "Very Satisfied", "Very Satisfied", "Very Satisfied", 
"Other", "Very Satisfied", NA, "Other", "Very Satisfied", "Very Satisfied", 
"Other", "Other"), year = c(1982L, 2012L, 1982L, 1982L, 1982L, 
2012L, 2012L, 2012L, 1982L, 1982L, 2012L, 2012L, 1982L, 1982L, 
1982L, 1982L, 2012L, 2012L, 1982L, 2012L, 2012L, 1982L, 1982L, 
2012L, 2012L, 2012L, 2012L, 1982L, 2012L, 2012L, 1982L, 2012L, 
2012L, 1982L, 1982L, 1982L, 1982L, 2012L, 1982L, 2012L, 2012L, 
2012L, 2012L, 2012L, 2012L, 1982L, 2012L, 1982L, 2012L, 1982L
)), .Names = c("type", "year"), row.names = c(NA, 50L), class = "data.frame")


gss_example %>% 
count(year, type) %>%
group_by(year) %>%
mutate(prop = n / sum(n)) %>%
select(-n) %>%
spread(key = type, value = prop) %>% 
arrange(desc(year)) %>% 
kable("html") %>%
kable_styling()

year

Other

Very Satisfied

<NA>

2012

0.2962963

0.5185185

0.1851852

1982

0.3043478

0.4347826

0.2608696

```
reprex::reprex_info()
#> Warning in as.POSIXlt.POSIXct(Sys.time()): unknown timezone 'default/
#> Europe/Paris'
#> Created by the reprex package v0.1.1.9000 on 2017-11-26

library (tidyverse)
#> Loading tidyverse: ggplot2
#> Loading tidyverse: tibble
#> Loading tidyverse: tidyr
#> Loading tidyverse: readr
#> Loading tidyverse: purrr
#> Loading tidyverse: dplyr
#> Warning: package 'dplyr' was built under R version 3.4.2
#> Conflicts with tidy packages ----------------------------------------------
#> filter(): dplyr, stats
#> lag():    dplyr, stats
library(knitr)
library(kableExtra)

data.frame(stringsAsFactors=FALSE,
                        type = c("Very Satisfied", NA, "Very Satisfied", "Very Satisfied",
                                 "Very Satisfied", "Very Satisfied"),
                        year = c(1982L, 2012L, 1982L, 1982L, 1982L, 2012L)) %>% 
count(year, type) %>%
group_by(year) %>%
mutate(prop = n / sum(n)) %>%
select(-n) %>%
spread(key = type, value = prop) %>% 
arrange(desc(year)) %>% 
kable("html") %>%
kable_styling()

year

Very Satisfied

<NA>

2012

0.5

0.5

1982

1.0

NA

```
1 Like