I try to create a pdf report using Rmarkdown, but when I try to make a loop in fuction of the Periodo variable, the tables inclusion in params <- list(res1 = medias.F) doesn't work and I dont have an output error as reference. I always have as output the report (test.pdf) without any result table:
My R code is:

    # Packages
    library(tidyverse)
    library(hnp)
    library(multcomp)
    library(rmarkdown)


    # Open data set
    df_trats <- read.csv("https://raw.githubusercontent.com/Leprechault/trash/main/data.csv",sep=";")
    df_trats$Tratamento <- as.factor(df_trats$Tratamento)
    str(df_trats )
    names_trat<-unique(df_trats$Tratamento)


    # Loop for each Periodo variable

    res <- NULL

    id.tempo <- unique(unique(df_trats$Periodo))

    for(i in 1:length(id.tempo)){

      print("Período de tempo analisado")
      print(id.tempo[i])

      df.subset <- df_trats%>%dplyr::filter(Periodo==id.tempo[i])
      df.subset$Tratamento <- as.factor(df.subset$Tratamento)

      # Models
      model1<-glm(Evento~Tratamento, family="binomial", data=df.subset)
      model2<-glm(Evento~Tratamento, family="quasibinomial", data=df.subset)


      B<-hnp::hnp(model1, print.on = TRUE, plot=FALSE)
      qB<-hnp::hnp(model2, print.on = TRUE, plot=FALSE)

      pB<-B$out/B$total
      pqB<-qB$out/qB$total

      tvalues<-as.data.frame(rbind(pB=pB,pqB=pqB))
      choose.model <- rownames(tvalues%>%filter(V1==min(V1)))


      # Anova
      if(pB == choose.model){
        anova.df.B<-anova(model1, test="Chisq")
        print(anova(model1, test="Chisq"))
      } else(pqB == choose.model)
      anova.df.qB<-anova(model2, test="F")
      print(anova(model2, test="F"))
      #

      # Pairwise comparisions
      if(pB == choose.model){
        print("Medias dos tratamentos")
        medias <- df.subset %>%
          dplyr::group_by(Tratamento) %>%
          dplyr::summarize(Mortalidade=mean(Evento)*100, EP = (stats::sd(Evento)/sqrt(n()-1))*100)
        Comparacoes<-summary(glht(model1, linfct=mcp(Tratamento="Tukey")))
        (Comparacoes_up<-summary(Comparacoes, test = univariate()))
        pairwise.res.pB <- cld(Comparacoes_up, level=0.05, Letters= c(LETTERS, letters), decreasing=TRUE)
        medias.lcd<-cld(Comparacoes_up, level=0.05, Letters= c(LETTERS, letters), decreasing=TRUE)
        medias.F <- cbind(medias,as.vector(medias.lcd$mcletters$Letters))
        colnames(medias.F)<-c("Tratamento","Mortalidade","EP","Índice")
        print(medias.F)
      } else(pqB == choose.model)
      print("Medias dos tratamentos")
      medias <- df.subset %>%
        dplyr::group_by(Tratamento) %>%
        dplyr::summarize(Mortalidade=mean(Evento)*100, EP = (stats::sd(Evento)/sqrt(n()-1))*100)
      Comparacoes<-summary(glht(model2, linfct=mcp(Tratamento="Tukey")))
      (Comparacoes_up<-summary(Comparacoes, test = univariate()))
      pairwise.res.pqB <- cld(Comparacoes_up, level=0.05, Letters= c(LETTERS, letters), decreasing=TRUE)
      medias.lcd<-cld(Comparacoes_up, level=0.05, Letters= c(LETTERS, letters), decreasing=TRUE)
      medias.F <- cbind(medias,as.vector(medias.lcd$mcletters$Letters))
      colnames(medias.F)<-c("Tratamento","Mortalidade","EP","Índice")
      print(medias.F)
      params <- list(res1 = medias.F) # ... whatever you have to send to the report
    rmarkdown::render("test.Rmd",
                        params = params,
                        output_file ="test.pdf",
                      envir = new.env())

    }
    ##
    # <END> -
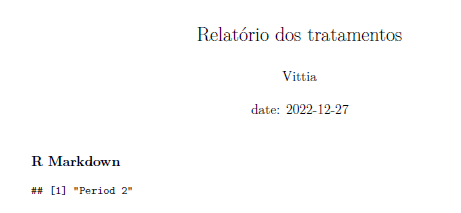
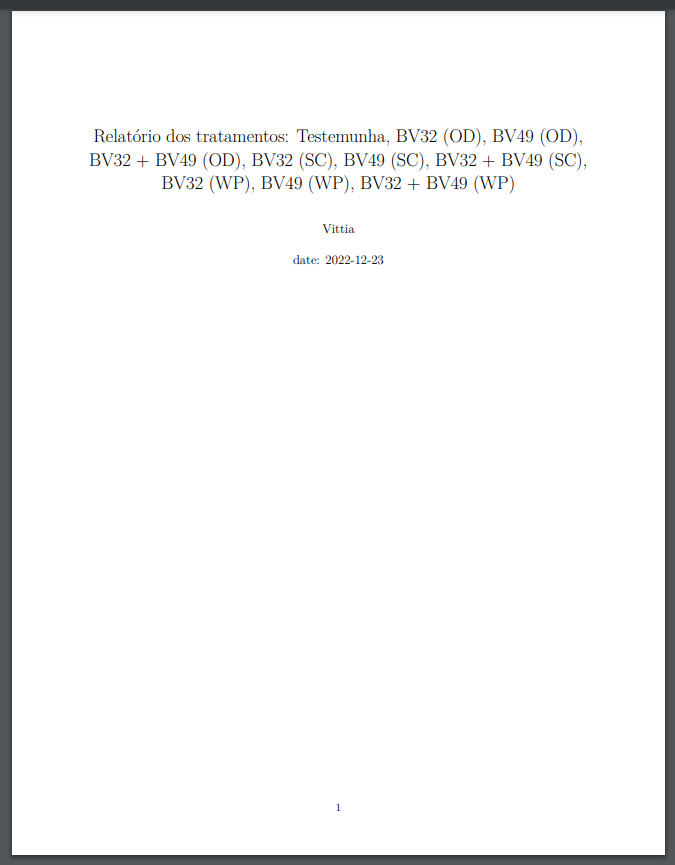
My test.Rmd is:
    ---
    title:  "Relatório dos tratamentos: `r names_trat`"
    author: "Vittia"
    date: "date: `r Sys.Date()`"
    params:
      res1: res1
    output: pdf_document
    ---


    ```{r setup, include=FALSE}
    knitr::opts_chunk$set(echo = FALSE)
Please any help with it?