Hello Andres, I'll do my best:
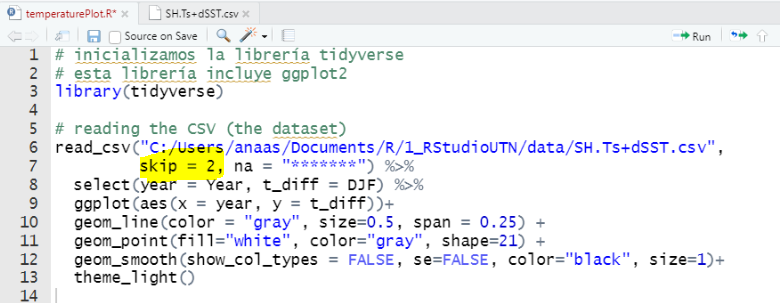
My code:
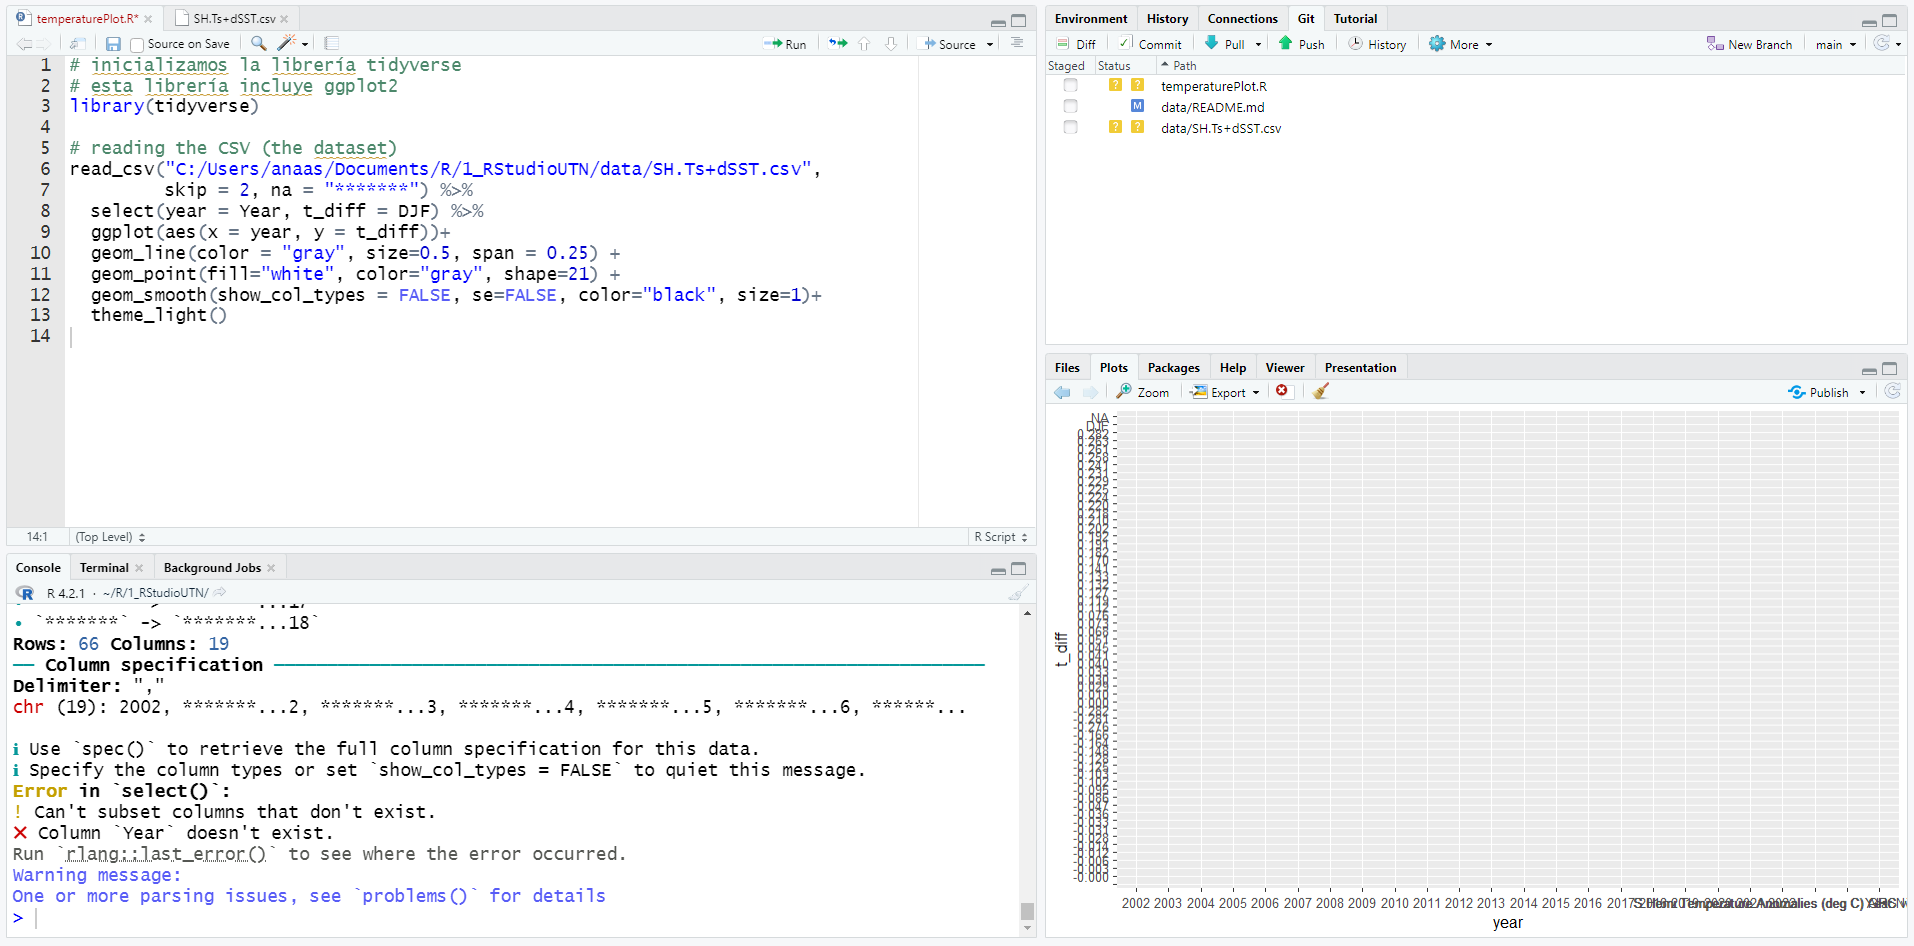
library(tidyverse)
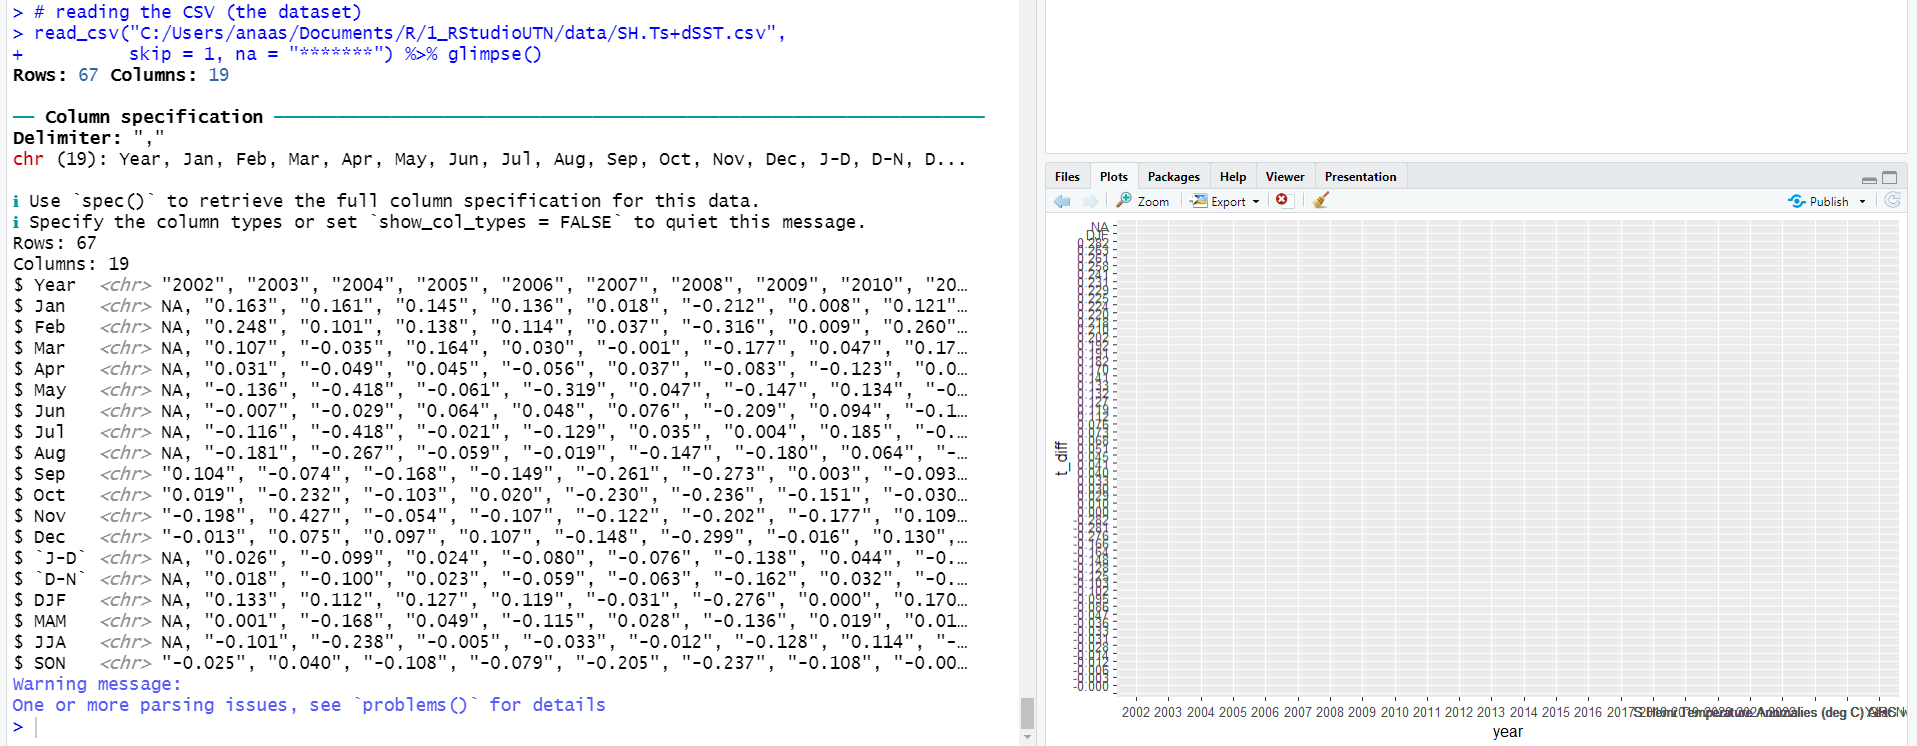
# reading the CSV
read_csv("C:/Users/anns/Documents/R/UTN/data/SH.Ts+dSST.csv",
skip = 1, na = "*******") +
select(year = Year, t_diff = DJF) %>%
ggplot(aes(x = year, y = t_diff)) +
geom_line(color = "gray", size=0.5, span = 0.25) +
geom_point(fill="white", color="gray", shape=21) +
geom_smooth(show_col_types = FALSE, se=FALSE, color="black", size=1) +
theme_light()
The dataset:
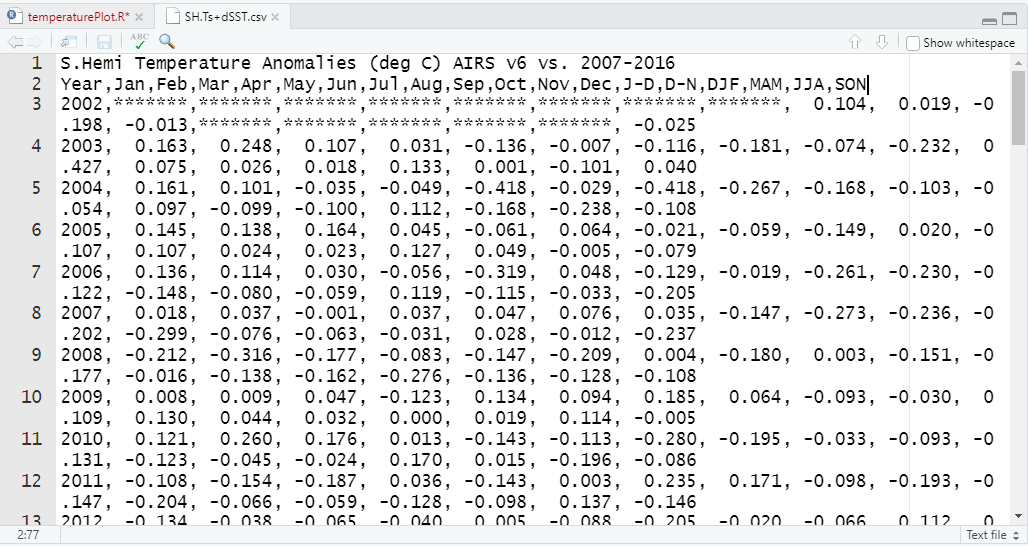
S.Hemi Temperature Anomalies (deg C) AIRS v6 vs. 2007-2016
Year,Jan,Feb,Mar,Apr,May,Jun,Jul,Aug,Sep,Oct,Nov,Dec,J-D,D-N,DJF,MAM,JJA,SON
2002,*******,*******,*******,*******,*******,*******,*******,*******,  0.104,  0.019, -0.198, -0.013,*******,*******,*******,*******,*******, -0.025
2003,  0.163,  0.248,  0.107,  0.031, -0.136, -0.007, -0.116, -0.181, -0.074, -0.232,  0.427,  0.075,  0.026,  0.018,  0.133,  0.001, -0.101,  0.040
2004,  0.161,  0.101, -0.035, -0.049, -0.418, -0.029, -0.418, -0.267, -0.168, -0.103, -0.054,  0.097, -0.099, -0.100,  0.112, -0.168, -0.238, -0.108
2005,  0.145,  0.138,  0.164,  0.045, -0.061,  0.064, -0.021, -0.059, -0.149,  0.020, -0.107,  0.107,  0.024,  0.023,  0.127,  0.049, -0.005, -0.079
2006,  0.136,  0.114,  0.030, -0.056, -0.319,  0.048, -0.129, -0.019, -0.261, -0.230, -0.122, -0.148, -0.080, -0.059,  0.119, -0.115, -0.033, -0.205
2007,  0.018,  0.037, -0.001,  0.037,  0.047,  0.076,  0.035, -0.147, -0.273, -0.236, -0.202, -0.299, -0.076, -0.063, -0.031,  0.028, -0.012, -0.237
2008, -0.212, -0.316, -0.177, -0.083, -0.147, -0.209,  0.004, -0.180,  0.003, -0.151, -0.177, -0.016, -0.138, -0.162, -0.276, -0.136, -0.128, -0.108
2009,  0.008,  0.009,  0.047, -0.123,  0.134,  0.094,  0.185,  0.064, -0.093, -0.030,  0.109,  0.130,  0.044,  0.032,  0.000,  0.019,  0.114, -0.005
2010,  0.121,  0.260,  0.176,  0.013, -0.143, -0.113, -0.280, -0.195, -0.033, -0.093, -0.131, -0.123, -0.045, -0.024,  0.170,  0.015, -0.196, -0.086
2011, -0.108, -0.154, -0.187,  0.036, -0.143,  0.003,  0.235,  0.171, -0.098, -0.193, -0.147, -0.204, -0.066, -0.059, -0.128, -0.098,  0.137, -0.146
2012, -0.134, -0.038, -0.065, -0.040,  0.005, -0.088, -0.205, -0.020, -0.066,  0.112,  0.071,  0.046, -0.035, -0.056, -0.125, -0.034, -0.105,  0.039
2013,  0.113,  0.043, -0.015, -0.012, -0.118,  0.117, -0.129,  0.027,  0.240,  0.026,  0.023,  0.075,  0.033,  0.030,  0.068, -0.048,  0.005,  0.097
2014,  0.001, -0.161, -0.058,  0.003,  0.148, -0.043, -0.076, -0.026,  0.198,  0.110,  0.071,  0.043,  0.017,  0.020, -0.028,  0.031, -0.049,  0.126
2015,  0.047,  0.112,  0.028, -0.116, -0.063,  0.007, -0.068,  0.016,  0.022,  0.169,  0.082,  0.218,  0.038,  0.023,  0.068, -0.050, -0.015,  0.091
2016,  0.147,  0.208,  0.252,  0.286,  0.280,  0.156,  0.300,  0.291,  0.099,  0.287,  0.301,  0.129,  0.228,  0.235,  0.191,  0.273,  0.249,  0.229
2017,  0.161,  0.255,  0.258,  0.134,  0.306,  0.170,  0.217,  0.106,  0.087,  0.236,  0.046, -0.013,  0.164,  0.175,  0.182,  0.233,  0.164,  0.123
2018,  0.101,  0.010,  0.118,  0.278,  0.059,  0.166,  0.099,  0.062, -0.009,  0.085,  0.065,  0.204,  0.103,  0.085,  0.033,  0.152,  0.109,  0.047
2019,  0.209,  0.281,  0.285,  0.292,  0.222,  0.302,  0.406,  0.233,  0.188,  0.340,  0.315,  0.378,  0.288,  0.273,  0.231,  0.266,  0.314,  0.281
2020,  0.250,  0.060,  0.047,  0.288,  0.198,  0.275,  0.288,  0.018,  0.188, -0.030,  0.114, -0.121,  0.131,  0.173,  0.229,  0.177,  0.193,  0.091
2021, -0.059, -0.129, -0.030, -0.001, -0.005,  0.020,  0.200,  0.072,  0.106, -0.210, -0.195,  0.058, -0.014, -0.029, -0.103, -0.012,  0.097, -0.100
2022,  0.063,  0.032,  0.137, -0.180, -0.057,  0.097,  0.004, -0.204,*******,*******,*******,*******,*******,*******,  0.051, -0.033, -0.034,*******
S.Hemi Temperature Anomalies (deg C) AIRS v7 vs. 2007-2016
Year,Jan,Feb,Mar,Apr,May,Jun,Jul,Aug,Sep,Oct,Nov,Dec,J-D,D-N,DJF,MAM,JJA,SON
2002,*******,*******,*******,*******,*******,*******,*******,*******,  0.316,  0.219,  0.080,  0.170,*******,*******,*******,*******,*******,  0.205
2003,  0.234,  0.269,  0.197,  0.244,  0.131,  0.189,  0.080, -0.011,  0.087, -0.075,  0.606,  0.247,  0.183,  0.177,  0.224,  0.191,  0.086,  0.206
2004,  0.269,  0.145,  0.061,  0.123, -0.287,  0.118, -0.353, -0.214, -0.011,  0.047,  0.082,  0.190,  0.014,  0.019,  0.220, -0.034, -0.150,  0.039
2005,  0.234,  0.208,  0.221,  0.181,  0.071,  0.162,  0.044,  0.035, -0.067,  0.108, -0.066,  0.126,  0.105,  0.110,  0.210,  0.158,  0.080, -0.008
2006,  0.151,  0.118,  0.063,  0.006, -0.219,  0.092, -0.073,  0.025, -0.208, -0.120, -0.043, -0.103, -0.026, -0.007,  0.132, -0.050,  0.015, -0.124
2007,  0.036,  0.049, -0.018,  0.079,  0.126,  0.131,  0.064, -0.115, -0.174, -0.200, -0.184, -0.296, -0.042, -0.026, -0.006,  0.062,  0.027, -0.186
2008, -0.224, -0.325, -0.195, -0.064, -0.141, -0.223,  0.086, -0.136, -0.007, -0.141, -0.148, -0.033, -0.129, -0.151, -0.282, -0.134, -0.091, -0.099
2009,  0.023, -0.033,  0.289, -0.080,  0.134,  0.128,  0.255,  0.073, -0.090, -0.025,  0.133,  0.084,  0.074,  0.065, -0.014,  0.114,  0.152,  0.006
2010,  0.121,  0.218,  0.145,  0.033, -0.082, -0.061, -0.277, -0.171, -0.033, -0.109, -0.145, -0.116, -0.040, -0.023,  0.141,  0.032, -0.170, -0.096
2011, -0.065, -0.125, -0.218,  0.036, -0.109,  0.028,  0.243,  0.151, -0.078, -0.165, -0.147, -0.217, -0.056, -0.047, -0.102, -0.097,  0.141, -0.130
2012, -0.221, -0.055, -0.093, -0.038,  0.032, -0.045, -0.204, -0.007, -0.099,  0.104, -0.001,  0.026, -0.050, -0.070, -0.164, -0.033, -0.086,  0.001
2013,  0.083,  0.024, -0.040,  0.008, -0.128,  0.144, -0.169,  0.005,  0.236, -0.016, -0.019,  0.044,  0.014,  0.013,  0.045, -0.053, -0.007,  0.067
2014, -0.001, -0.185, -0.065,  0.003,  0.144, -0.009, -0.071,  0.034,  0.201,  0.125,  0.061,  0.032,  0.023,  0.024, -0.047,  0.027, -0.015,  0.129
2015,  0.042,  0.154,  0.003, -0.156, -0.108, -0.101, -0.140, -0.044, -0.008,  0.175,  0.157,  0.291,  0.022,  0.001,  0.076, -0.087, -0.095,  0.108
2016,  0.205,  0.277,  0.191,  0.180,  0.132,  0.008,  0.213,  0.211,  0.053,  0.251,  0.294,  0.183,  0.183,  0.192,  0.258,  0.167,  0.144,  0.199
2017,  0.224,  0.267,  0.227,  0.066,  0.218, -0.005,  0.108,  0.017,  0.071,  0.142, -0.001, -0.010,  0.110,  0.127,  0.225,  0.170,  0.040,  0.071
2018,  0.112,  0.017,  0.067,  0.205,  0.021,  0.049, -0.003, -0.040, -0.064,  0.021,  0.037,  0.213,  0.053,  0.034,  0.040,  0.098,  0.002, -0.002
2019,  0.235,  0.341,  0.272,  0.190,  0.051,  0.072,  0.193,  0.149,  0.075,  0.249,  0.300,  0.348,  0.206,  0.195,  0.263,  0.171,  0.138,  0.208
2020,  0.249,  0.126,  0.050,  0.225,  0.110,  0.163,  0.148, -0.066,  0.174,  0.002,  0.159, -0.141,  0.100,  0.141,  0.241,  0.128,  0.082,  0.112
2021, -0.104, -0.141, -0.060, -0.060, -0.069, -0.097,  0.148,  0.079,  0.178,  0.018, -0.017,  0.228,  0.009, -0.022, -0.128, -0.063,  0.043,  0.060
2022,  0.226,  0.234,  0.241, -0.244,  0.096,  0.173,  0.124, -0.100,*******,*******,*******,*******,*******,*******,  0.229,  0.031,  0.066,*******
S.Hemi Temperature Anomalies (deg C) GHCNv4/ERSSTv5 vs. 2007-2016
Year,Jan,Feb,Mar,Apr,May,Jun,Jul,Aug,Sep,Oct,Nov,Dec,J-D,D-N,DJF,MAM,JJA,SON
2002,  0.006, -0.052,  0.127,  0.166,  0.190, -0.134,  0.022, -0.098,  0.024, -0.032, -0.163, -0.057, -0.000,  0.000, -0.033,  0.161, -0.070, -0.057
2003,  0.055,  0.125,  0.007,  0.004, -0.081, -0.095, -0.061, -0.181, -0.148, -0.110, -0.153, -0.000, -0.053, -0.058,  0.041, -0.023, -0.112, -0.137
2004, -0.016,  0.048, -0.122,  0.030, -0.364, -0.104, -0.510, -0.246, -0.203, -0.068, -0.085,  0.056, -0.132, -0.137,  0.010, -0.152, -0.287, -0.119
2005,  0.029,  0.005,  0.018, -0.078, -0.095, -0.008, -0.059, -0.095, -0.092, -0.026, -0.145,  0.011, -0.045, -0.041,  0.030, -0.052, -0.054, -0.088
2006, -0.044,  0.023, -0.044, -0.149, -0.390, -0.009, -0.159,  0.124, -0.135, -0.146, -0.025, -0.090, -0.087, -0.079, -0.003, -0.194, -0.015, -0.102
2007,  0.066,  0.023, -0.026, -0.045,  0.070,  0.061,  0.003, -0.145, -0.085, -0.236, -0.199, -0.290, -0.067, -0.050, -0.000, -0.000, -0.027, -0.173
2008, -0.243, -0.310, -0.178, -0.068, -0.201, -0.152,  0.056, -0.286,  0.036, -0.099, -0.143, -0.088, -0.140, -0.156, -0.281, -0.149, -0.127, -0.068
2009, -0.049, -0.121, -0.039,  0.027,  0.056,  0.104,  0.255,  0.032, -0.019, -0.071,  0.191,  0.174,  0.045,  0.023, -0.086,  0.015,  0.130,  0.033
2010,  0.178,  0.253,  0.223,  0.069, -0.012,  0.006, -0.172, -0.139, -0.058, -0.066, -0.134, -0.117,  0.003,  0.027,  0.202,  0.094, -0.102, -0.086
2011, -0.085, -0.083, -0.099, -0.037, -0.179, -0.017,  0.147,  0.168, -0.221, -0.172, -0.048, -0.196, -0.068, -0.062, -0.095, -0.105,  0.100, -0.147
2012, -0.219, -0.082, -0.081, -0.114,  0.008, -0.159, -0.223, -0.069, -0.043,  0.096,  0.038,  0.094, -0.063, -0.087, -0.166, -0.062, -0.150,  0.031
2013,  0.050, -0.020,  0.011, -0.092, -0.149,  0.102, -0.034,  0.034,  0.226, -0.026, -0.009,  0.038,  0.011,  0.016,  0.041, -0.076,  0.034,  0.064
2014,  0.023, -0.099, -0.160,  0.019,  0.237,  0.020, -0.142,  0.133,  0.298,  0.103, -0.031, -0.050,  0.029,  0.037, -0.012,  0.032,  0.004,  0.123
2015,  0.006,  0.132,  0.061,  0.004, -0.032,  0.060,  0.004, -0.024, -0.096,  0.313,  0.179,  0.267,  0.073,  0.046,  0.029,  0.011,  0.013,  0.132
2016,  0.272,  0.307,  0.289,  0.236,  0.200, -0.027,  0.106,  0.297, -0.037,  0.157,  0.156,  0.169,  0.177,  0.185,  0.282,  0.242,  0.125,  0.092
2017,  0.137,  0.268,  0.280,  0.196,  0.314,  0.002,  0.128,  0.112, -0.082,  0.170, -0.018, -0.043,  0.122,  0.140,  0.192,  0.263,  0.081,  0.023
2018, -0.029, -0.036,  0.080,  0.323,  0.052,  0.180,  0.210,  0.051,  0.018,  0.216,  0.121,  0.220,  0.117,  0.095, -0.036,  0.152,  0.147,  0.118
2019,  0.145,  0.290,  0.272,  0.289,  0.134,  0.113,  0.318,  0.194,  0.021,  0.138,  0.229,  0.260,  0.200,  0.197,  0.218,  0.231,  0.208,  0.129
2020,  0.227,  0.295,  0.156,  0.366,  0.171,  0.198,  0.160,  0.008,  0.155, -0.026,  0.039, -0.125,  0.135,  0.167,  0.261,  0.231,  0.122,  0.056
2021, -0.159, -0.161,  0.043, -0.112, -0.056, -0.036,  0.229, -0.009,  0.172,  0.098,  0.001,  0.047,  0.005, -0.009, -0.148, -0.042,  0.062,  0.090
2022,  0.045,  0.127,  0.143,  0.085,  0.078,  0.208,  0.275,  0.110,*******,*******,*******,*******,*******,*******,  0.073,  0.102,  0.198,*******
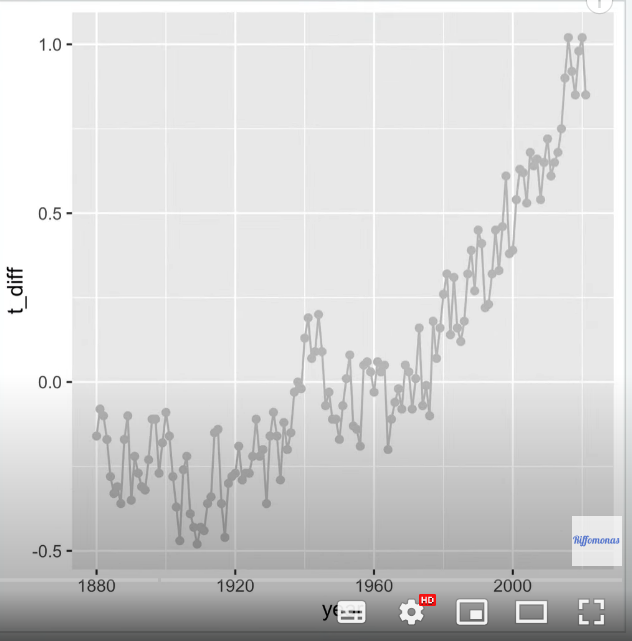
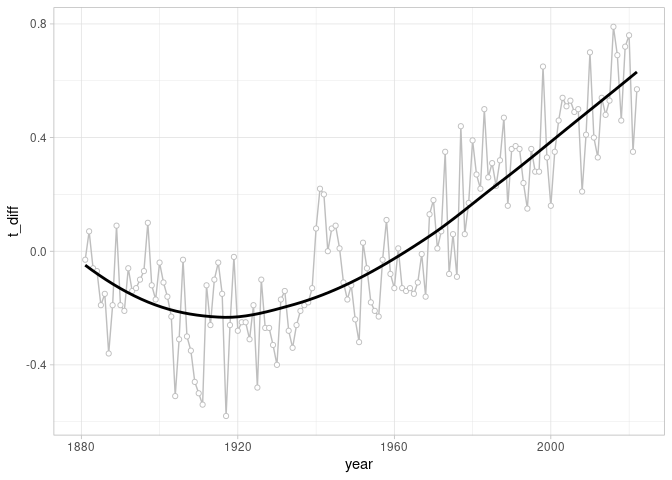
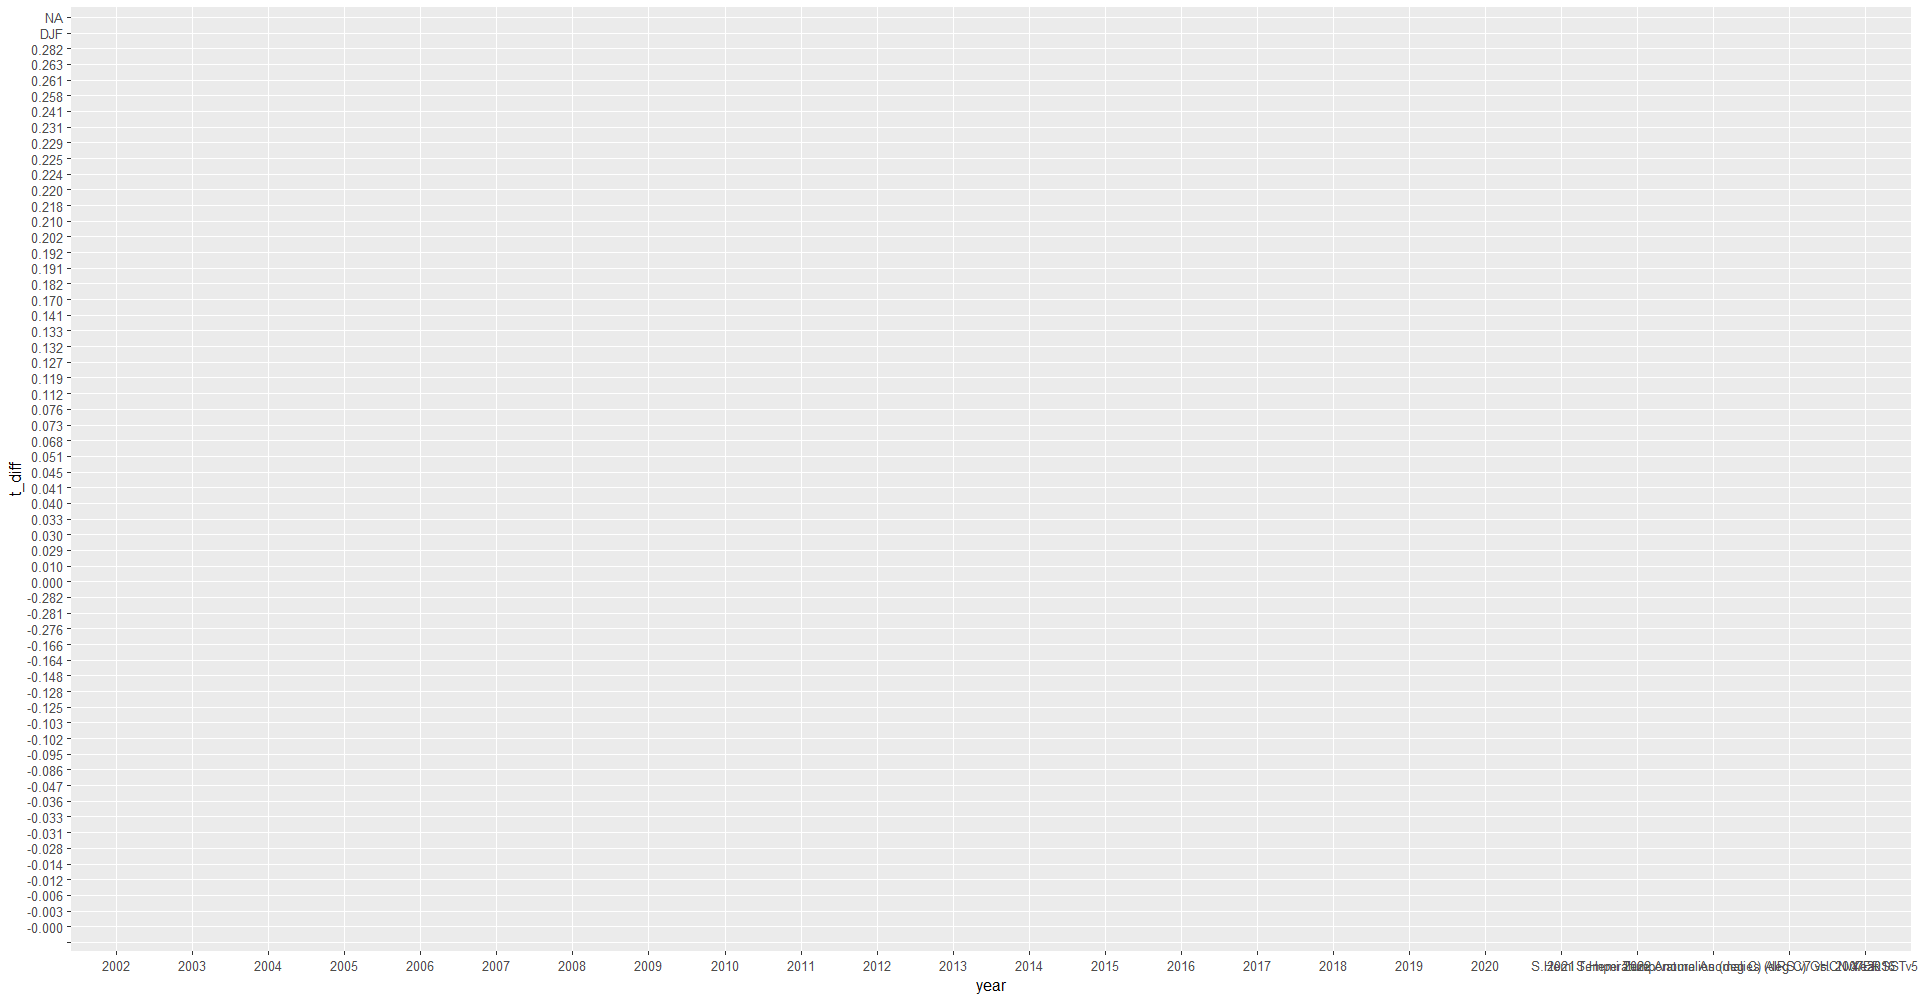
The outcome of my code: