I am trying to make a ggplot2 wrapper that adjusts the scale on the y-axis depending on the scale of y.
- plot_1: gives an error
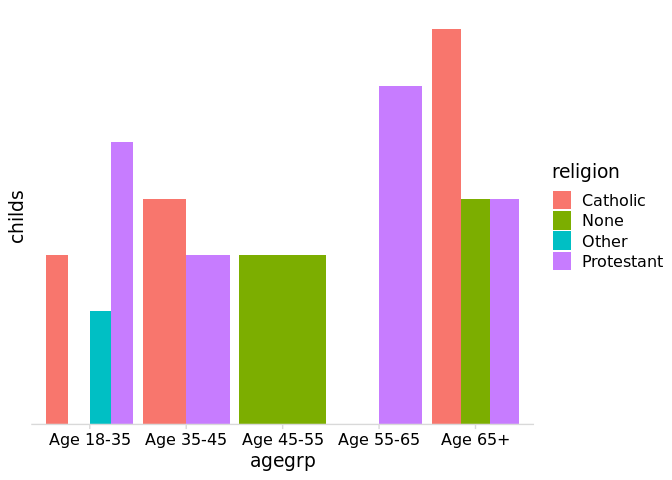
- plot_2: with tidyeval, but the output has no
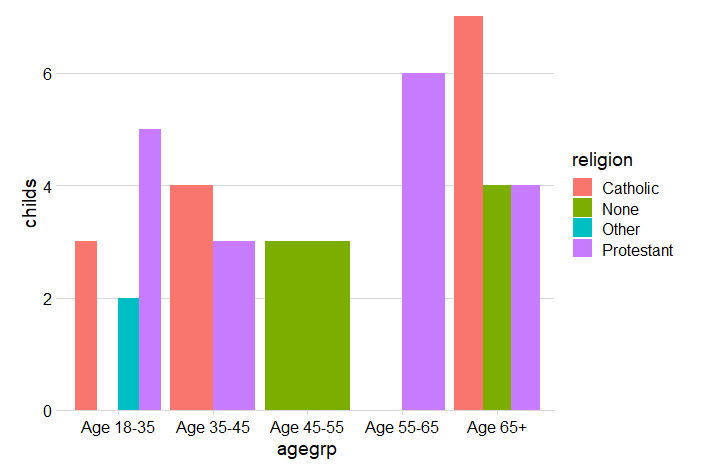
values on the y-axis - plot_3: this is how it should look
Any idea what causes this problem?
Maybe there is a different approach to this problem?
I hope the example helps to understand my problem. Thanks in advance!
# setup -------------------------------------------------------------------

library(ggplot2)

df <- data.frame(
  childs = c(3, 0, 2, 4, 2, 2, 2, 3, 3, 4, 5, 4, 3, 5, 7, 2, 6, 5, 0, 2),
  agegrp = as.factor(c("Age 45-55",
                       "Age 55-65","Age 65+","Age 35-45","Age 45-55","Age 45-55",
                       "Age 45-55","Age 18-35","Age 35-45","Age 65+",
                       "Age 18-35","Age 65+","Age 18-35","Age 55-65",
                       "Age 65+","Age 18-35","Age 55-65","Age 55-65",
                       "Age 18-35","Age 35-45")),
  religion = as.factor(c("None","None",
                         "Catholic","Catholic","None","None","None","Catholic",
                         "Protestant","None","Protestant","Protestant",
                         "Catholic","Protestant","Catholic","Other",
                         "Protestant","Protestant","None","Protestant"))
)

# function ----------------------------------------------------------------

plot_1 <- function(data, x, y, fill) {

  plot <-
    ggplot(data = data,
           mapping = aes(x = {{ x }}, y = {{ y }}, fill = {{ fill }})) +
    geom_col(position = "dodge")

  if (is.numeric(y)) {
    scale <-
      scale_y_continuous(expand = expansion(mult = c(0, 0.05)),
                         breaks = scales::breaks_extended(),
                         labels = scales::label_number(big.mark = "'"))
  } else {
    scale <-
      scale_y_discrete(expand = expansion(mult = c(0, 0.05)),
                       breaks = scales::breaks_extended(),
                       labels = scales::label_number(big.mark = "'"))
  }

  plot +
    scale +
    cowplot::theme_minimal_hgrid()
}

plot_2 <- function(data, x, y, fill) {

  plot <-
    ggplot(data = data,
           mapping = aes(x = {{ x }}, y = {{ y }}, fill = {{ fill }})) +
    geom_col(position = "dodge")

  cond <- enquo(y) # tidyeval

  if (is.numeric(cond)) {
    scale <-
      scale_y_continuous(expand = expansion(mult = c(0, 0.05)),
                         breaks = scales::breaks_extended(),
                         labels = scales::label_number(big.mark = "'"))
  } else {
    scale <-
      scale_y_discrete(expand = expansion(mult = c(0, 0.05)),
                       breaks = scales::breaks_extended(),
                       labels = scales::label_number(big.mark = "'"))
  }

  plot +
    scale +
    cowplot::theme_minimal_hgrid()
}

plot_3 <- function(data, x, y, fill) {

  plot <-
    ggplot(data = data,
           mapping = aes(x = {{ x }}, y = {{ y }}, fill = {{ fill }})) +
    geom_col(position = "dodge")

  plot +
    cowplot::theme_minimal_hgrid()
}

# test --------------------------------------------------------------------

plot_1(df, agegrp, childs, religion)
#> Error in plot_1(df, agegrp, childs, religion): object 'childs' not found
plot_2(df, agegrp, childs, religion)
plot_3(df, agegrp, childs, religion)

Created on 2022-10-14 by the reprex package (v2.0.1)