Tips for fixing my Shiny app window size? Plots are squished (reprex+GIF included)

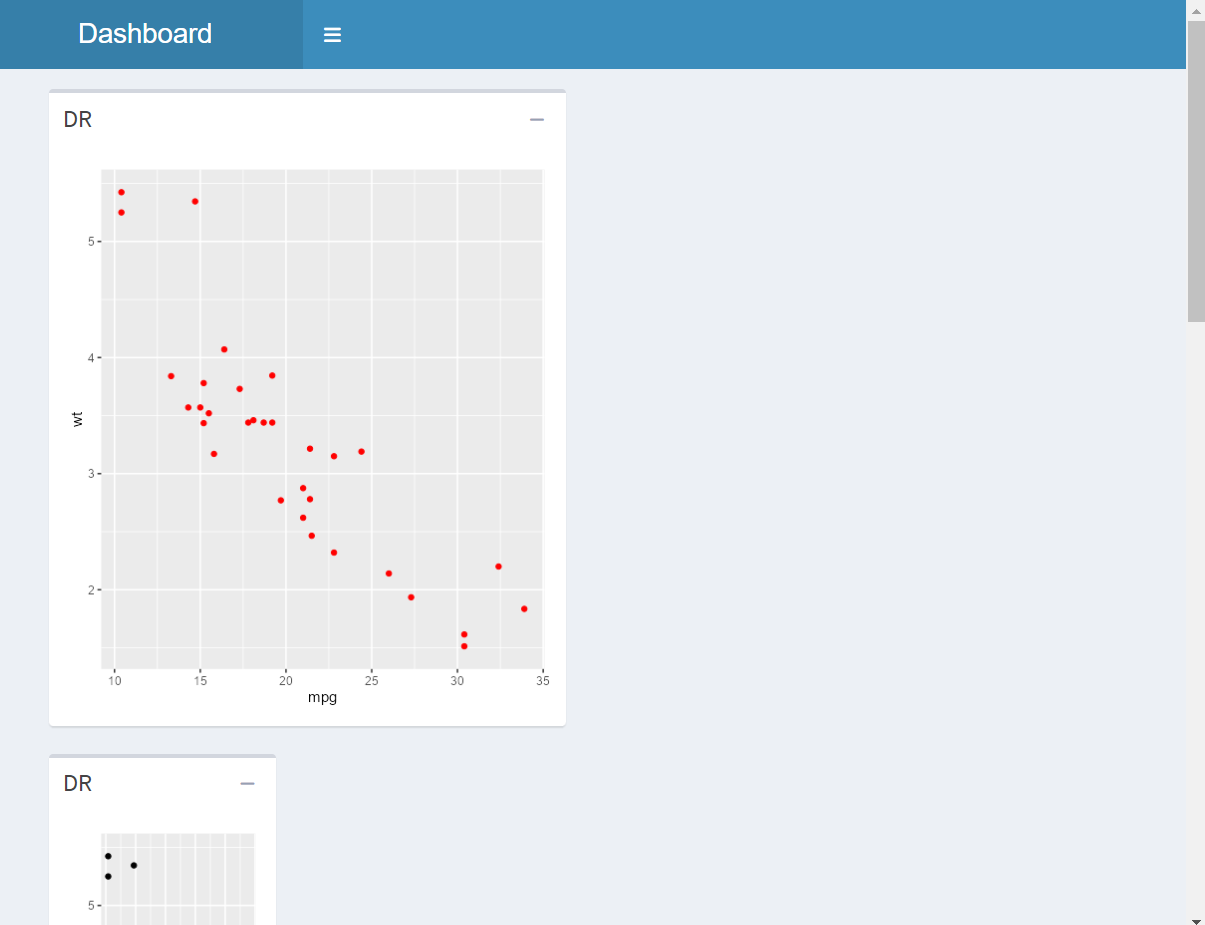
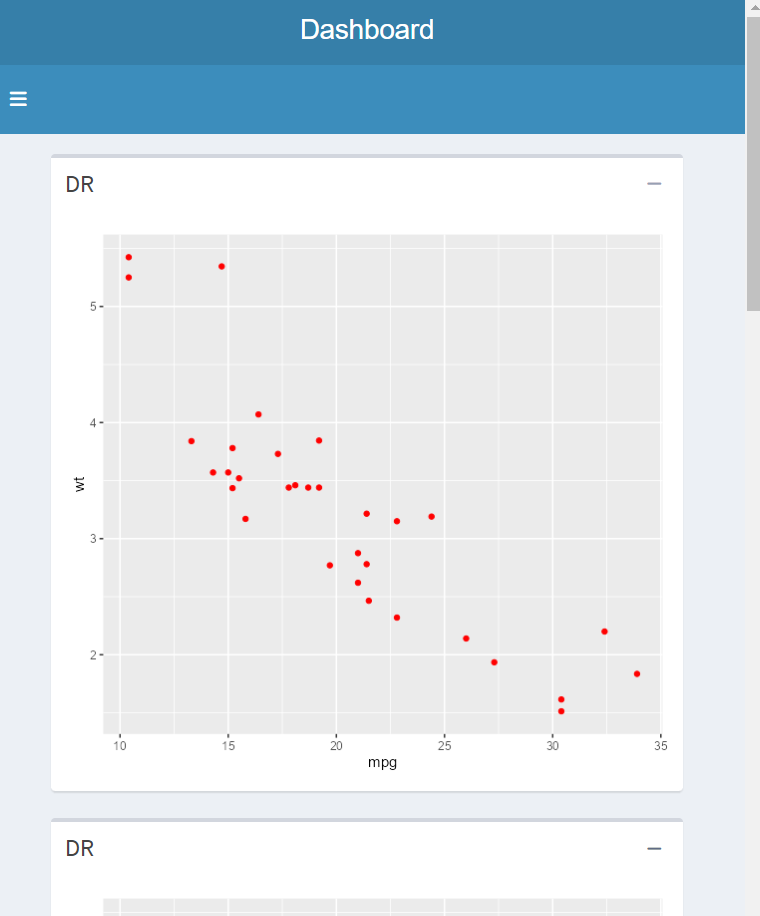
Plots within my Shiny app adjust according to window size (as expected, otherwise I suppose I'd set the min-width and max-width to be equal for a fixed size in the CSS part).

However....on smaller screens like my laptop, the plots are far too squished. Then, when the app window shrinks even further, the plots don't return to normal size, but rather become a much larger size than I want.

How should I handle this? I'd like there to be a minimum width, but for the plots to go back to 'normal/original' size when the window gets below that width, rather than the plots becoming too big.

Min Reprex + GIF to demonstrate:

#--------------------------------------------------------------
# Load libraries
library(shiny)
library(shinydashboard)
library(ggplot2)
#--------------------------------------------------------------

ui <- tagList(
  dashboardPage(

    dashboardHeader(title = "Dashboard"),
    dashboardSidebar( minified = TRUE, collapsed = TRUE, sidebarMenu(
      menuItem("Instructions", tabName = "genIns", icon = icon("info-circle")),
      menuItem("Data", tabName = "data", icon = icon("table"))
      
    )),
    dashboardBody(
      

      tags$head(tags$style(HTML(
                        
                                ####################################################
                                #####TRYING CSS TO FIX WINDOW SIZING HERE###########
                                ####################################################
                                "
                                 /* App window sizing*/
                                 body{
                                 min-width: 900px;
                                 margin: auto;
                                 overflow: auto;
                                 }
                                "

                                ))),
  
      tabItems(
        # First tab content
        tabItem(tabName = "genIns",
                fluidPage(
                  fluidRow(
                    column(width=6, 
                           box(plotOutput("myplot"),
                               collapsible = TRUE, 
                               title = "DR"
                    
                           ))),
                  fluidRow(
                    column(width=6, 
                           box(plotOutput("myplot2"),
                               collapsible = TRUE, 
                               title = "DR"
                       
                           ))),
                  fluidRow(
                    column(width=6, 
                           box(plotOutput("myplot3"),
                               collapsible = TRUE, 
                               title = "DR"
                       
                           ))),
                  
                  fluidRow(
                    column(width=6, 
                           box(plotOutput("myplot4"),
                               collapsible = TRUE, 
                               title = "DR"


                           ))))
           
        ),
        # Second tab content
        tabItem(tabName = "data",
                sliderInput("bins",
                            "Number of bins:",
                            min = 1,
                            max = 50,
                            value = 30))))
    
  ),#end dashboardPage

)#end tagList


server <- shinyServer(function(input, output, session) {
  
  
  output$myplot <- renderPlot({
    p <- ggplot(mtcars, aes(x=mpg, y=wt)) + geom_point(color="red")
    
    return(p)
  })
  
  output$myplot2 <- renderPlot({
    p <- ggplot(mtcars, aes(x=mpg, y=wt)) + geom_point(color="black")
    
    return(p)
  })
  
  output$myplot3 <- renderPlot({
    p <- ggplot(mtcars, aes(x=mpg, y=wt)) + geom_point(color="green")
    
    return(p)
  })
  
  output$myplot4 <- renderPlot({
    p <- ggplot(mtcars, aes(x=mpg, y=wt)) + geom_point(color="pink")
    
    return(p)
  })
  
  
})

shinyApp(ui, server)

shiny_recording

Increasing column widths from 6 to 12 helps on the "too squished" issue. The first plot below is width 12, the second is width 6.

When the window size shrinks more, both graphs fill the width (I can't reproduce the horizontal scroll bar that appears in your GIF).

1 Like

I got a much better result by adjusting the widths of the columns to be 12, and the widths of the boxes within the columns to be 6 (previously I did not set that parameter).

For the scrollbar, I think I read that overflow:auto; will produce different results in different browsers compared to overflow-x:scroll; , which I've now changed my code to.

Thanks!

1 Like

This topic was automatically closed 7 days after the last reply. New replies are no longer allowed.

If you have a query related to it or one of the replies, start a new topic and refer back with a link.